The Indian Story Data Prep
Data
Here we speak about the dataset and munging that we do upon it. In order to create the visualisations and eventually build the Application it is important to have the data in the right form. Let's start with examining the data in its initial form.
Data as downloaded from the website
The copy of the data can be downloaded from this link here
Here is a portion of the data excel data source that somewhat gives us an overview of the data. I'll explain more in the tables below. Sometimes visually looking at the data helps flare off ideas on how to munge it.
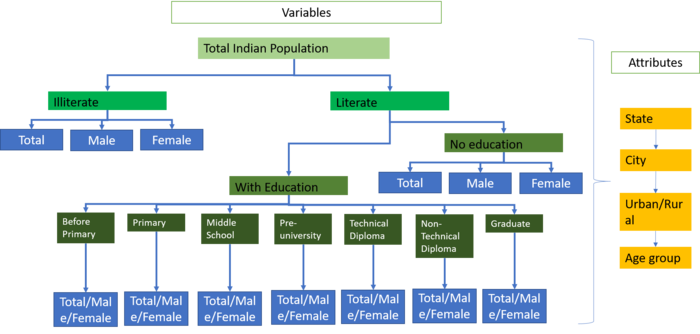
The data file is quite a clean file with no missing values. Those with no values are replaced with 0 and they are all in terms of population numbers. No ratios have been computed except for totals. A glance at the data file above will give you the impression that there is more than one level of data and that information is in the hierarchical form. The picture below is what we visualise the dataset to be conceptually.
Every row has certain data attributes. Population information in each row has a hierachial structure beginning with the state code followed by the city/town name then whether it is an Urban or a rural city and finally the age group. Here however there isn't a particular state name given for the state code. This is where the second dataset comes in and helps us understand the meaning of the state codes.
Next the variables also have a hierarchial structure.


