ISSS608 2016-17 T3 Assign GUAN YIFEI Visualization
|
|
|
|
|
Viz & Insights
The Daily Trends
Note: The outliers observed in part 3 were removed for the analysis of long period patterns to avoid misunderstandings.
| Patterns | Visualization |
|---|---|
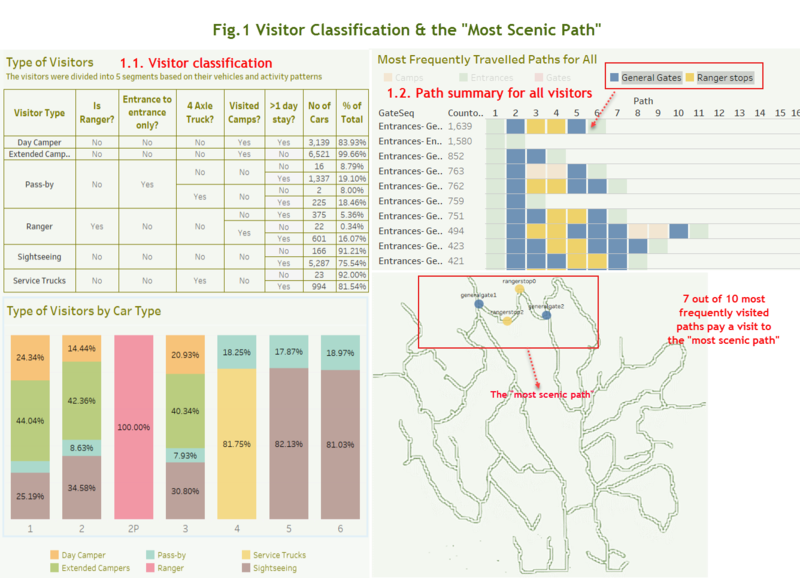
| 1. Setting the scene – classification of visitors & the “most scenic path”
|
|
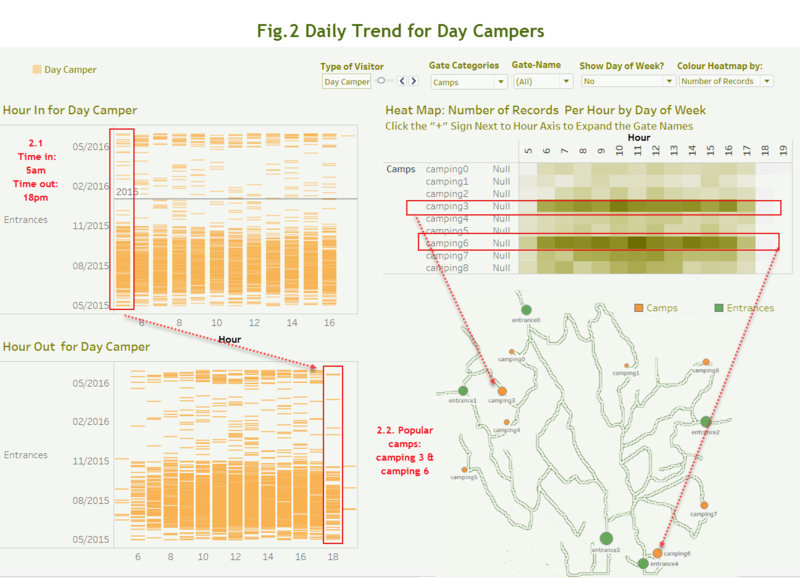
| 2.Day Campers Refer to Fig 2.1, day campers started to enter the reserve at 5am and left the park by 18:00. In terms of camp selection, Fig 2.2 reveals that camp3 and 6 are their most popular choices, possibly because they are located nearer to the entrances. Accessibility could be one of the considerations for the day campers in choosing their campaign locations due to the limited time they have in the park. |
|
| 3.Extended campers
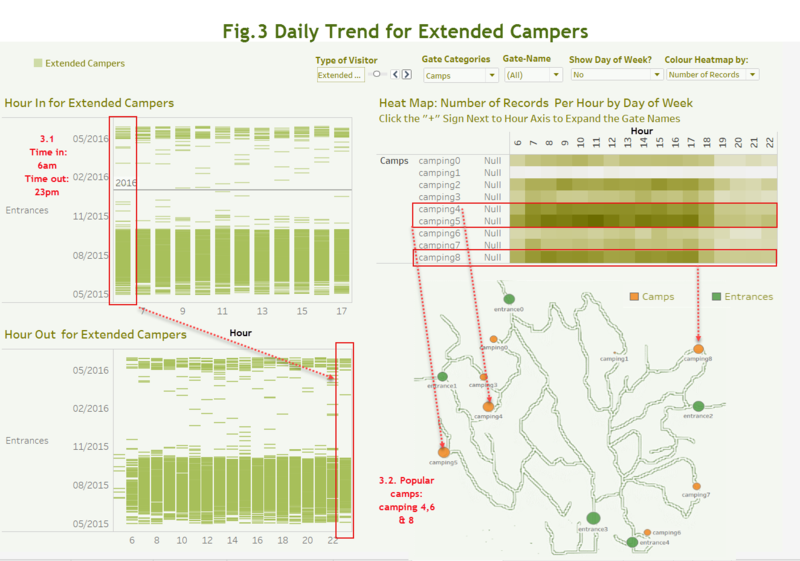
The day for extended campers started a bit later than day campers, from 6am onwards. The time of exit for them also spread over a longer time range (Fig 3.1). Unlike the day campers, they tend to settle down at the more secluded camp sites like camp 5 and camp 8, to enjoy a quiet night of sleep (Fig 3.2). |
|
| 4.Rangers
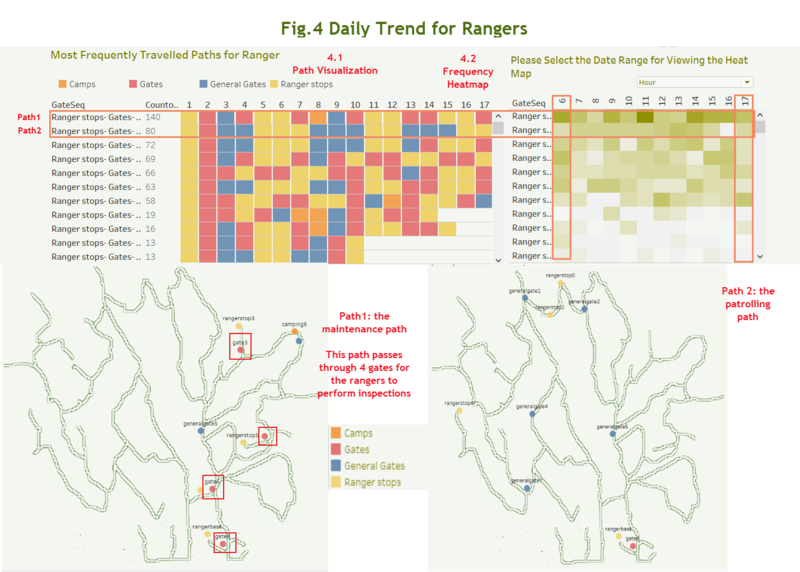
The day of rangers started from the ranger base and ends there with their first shift started at 6am and the last shift started at 17pm (Fig 4.2). They travelled by long but fixed paths, the reason could be that they are working on routine shifts (Fig 4.1). There are two typical paths adopted by the rangers, the maintenance path and the patrolling path. The maintenance path passed through various restricted gates, which was normally started at 6am,11am and 14pm. The patrolling path covered the entire reserve, started at regular hour intervals. |
|
| 5.Service Trucks
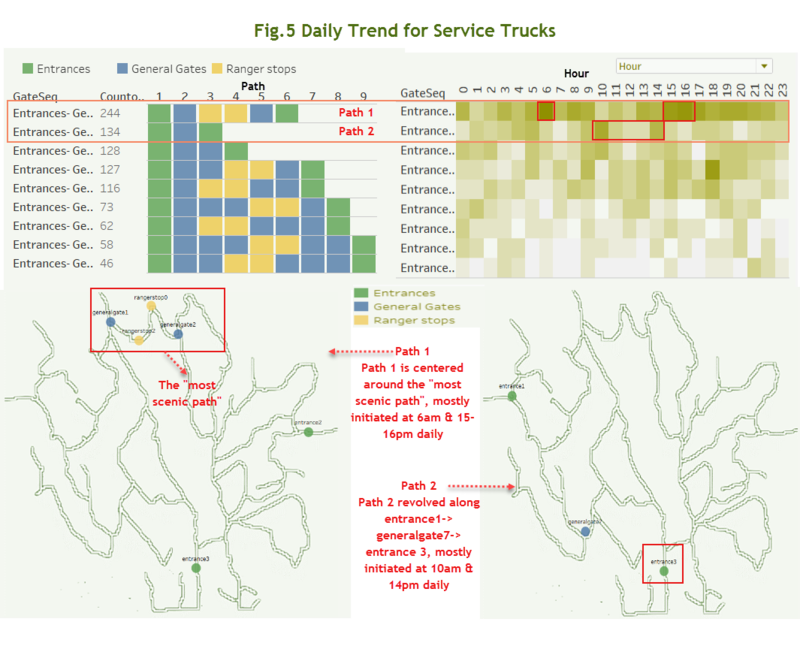
The service trucks are axle-4 and above heavy vehicles which moved around the reserve throughout the day. They seemed to be visiting the reserve at fixed hours daily – majority of them reported to the “most scenic path” at 6am and 15-16pm daily (path 1 in Fig 5) while the others revolved along entrance 1->generalgate7->entrance 3 at 10am & 14pm daily. These are probably service or supplies trucks transporting goods in and out of the reserve. |
|
| 6.Sightseeing coaches
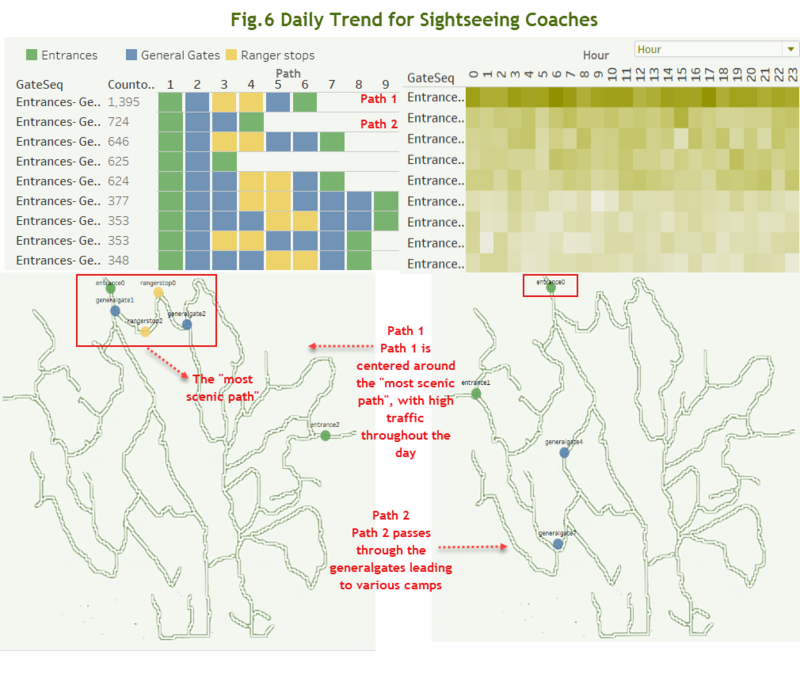
The sightseeing coaches brought guests to the reserves throughout the day, without entering into the camp sites. Majority of the visitors were brought to the “most scenic path” from different entrances (path 1 in Fig 6) while the rest were dropped along the camping path (path 2 in Fig 6) which connected camps 3,4,5. Unlike the truck drivers, the sightseeing coaches used entrance 3 instead. |
The Longer Period Trends
Note: The outliers observed in part 3 were removed for the analysis of long period patterns to avoid misunderstandings.
| Patterns | Visualization |
|---|---|
| 1.Campers
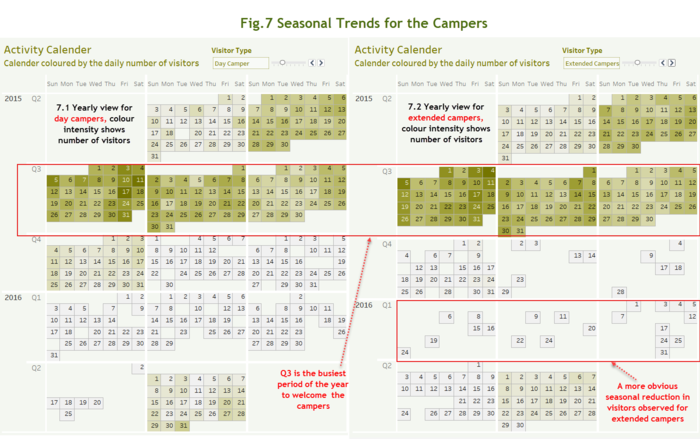
Fig 7 provides the yearly visitor traffic calendar for the campers. The campers visited the reserve more often from May to Aug, possibly because this is the warm period of the year. The highest traffic of campers was observed in July 2015. There is a drastic drop in the campers, especially extended campers, from Q4 2015 onwards, which could be attributed to the colder weather. |
|
| 2. Rangers Trend
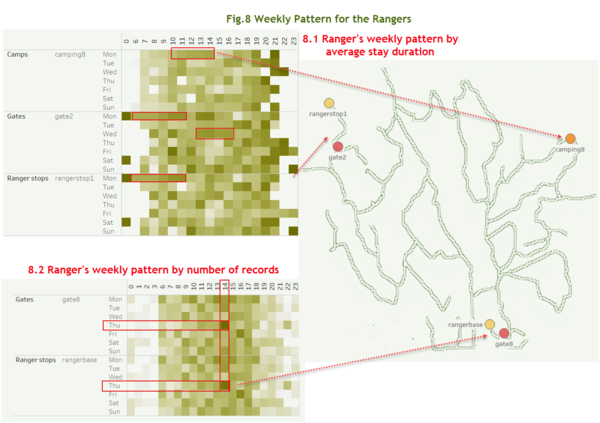
In Fig 8.2 we could see the rangers gathered at the rangerbase and gate 8 (which is in close proximity to the ranger base) on Thursdays 14pm. It could be an indication that the weekly ranger meetings were held on Thursdays 14pm at the rangerbase. |
|
| 3.Service Trucks
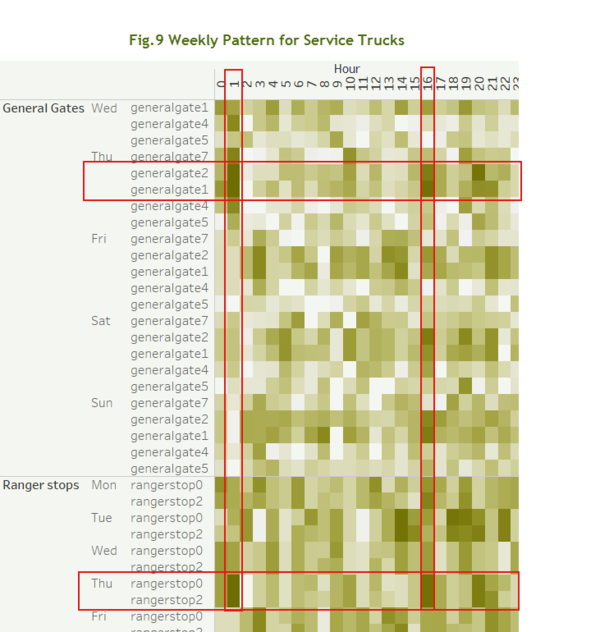
Fig 9 below shows the weekly movement pattern for service trucks at various gates. We noticed that there were a higher number of service trucks moved pass the “connecting path” on Thursdays, at two prominent timings: 1am and 16pm. This might be the scheduled delivery/pick up hours for the service trucks. |
|
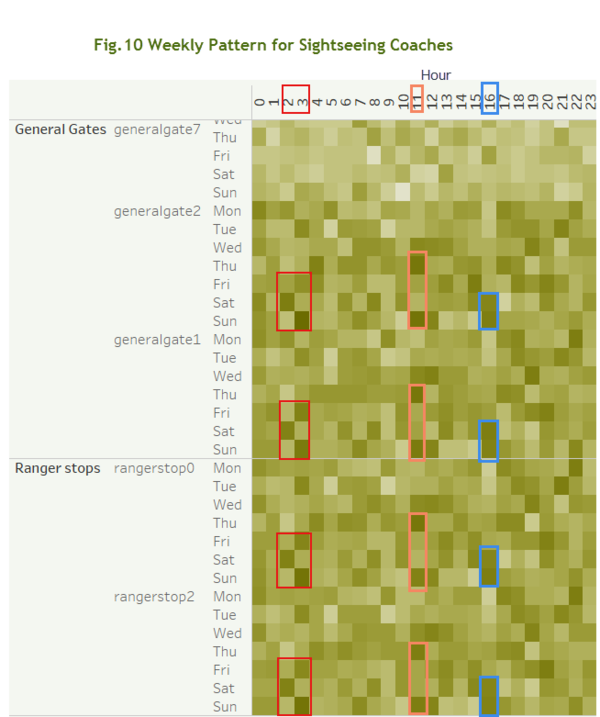
| 4. Sightseeing coaches
-Fridays & Sundays 3am -Thursdays & Sundays 11am -Sundays 16pm -Mondays 22 pm |
The Anomalies
The design
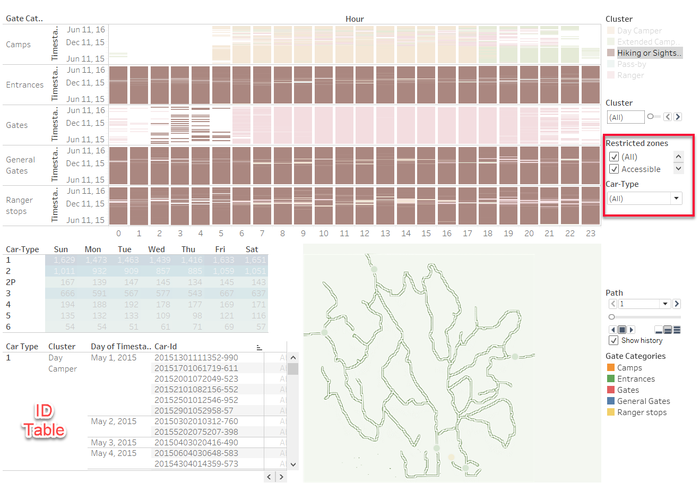
1.The Gantt chart shows all the activities in the reserve over the time span, one Gantt bar indicating one movement.
2.Filters allow the user to filter by restricted areas /car type/cluster
3.Select the suspicious bars to view the heat map distribution to confirm if the observation is within certain car type or happened on certain days of the week
4.Click on the interested area of the heatmap to view the detailed ID table
5.Click on the car ID to view its animated path
| Anomalies & Car ID | Visualization |
|---|---|
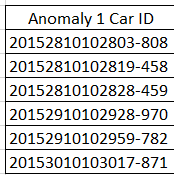
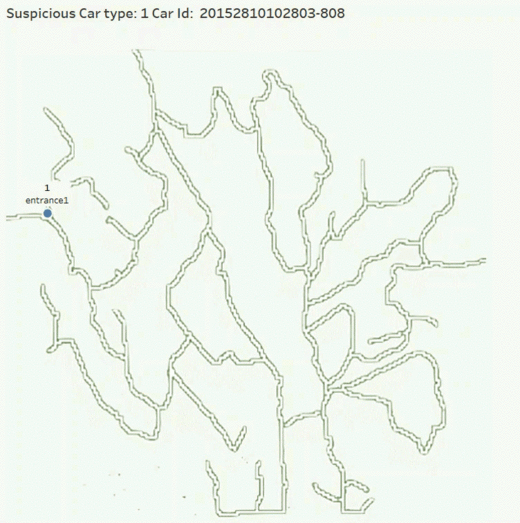
1.A group of 6 cars (type 1) trespassing restricted area ranger stop 1, on 10 July 2015 |
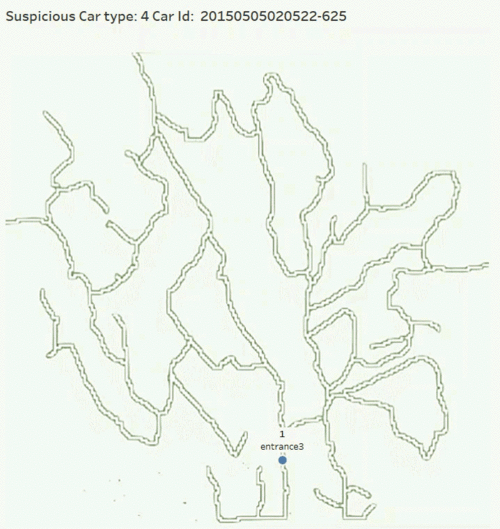
The gif below shows the paths adopted by the suspicious vehicles,the restricted gates are colored in red. |
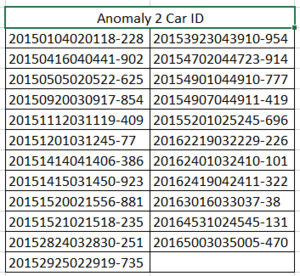
| 2.Type 4 vehicle trespassing restricted areas 23 times on Tuesdays and Thursdays 2 to 5 am, following the same path | The gif below shows the paths adopted by the suspicious vehicles,the restricted gates are colored in red. |
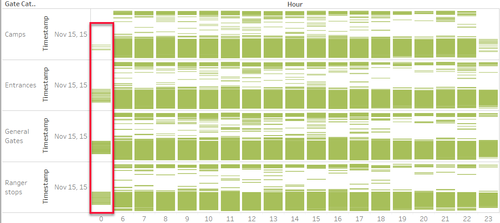
| 3.The same extended camper ( 20154519024544-322 ) active at various midnight continuously |
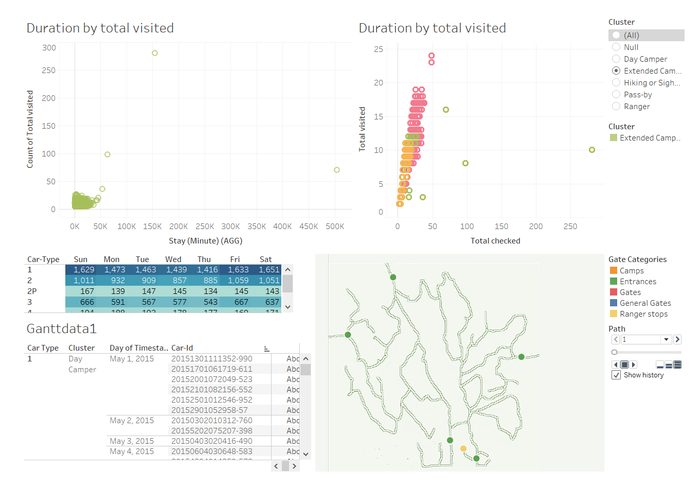
Design 2, similar concepts to design 1 but focuses on the duration,gate checked and gate visited by each tourist.
• Total checked: the total number of stops each tourist went
• Total visited: the number of distinct stops each tourist went Car Type
| Anomalies & Car ID | Visualization |
|---|---|
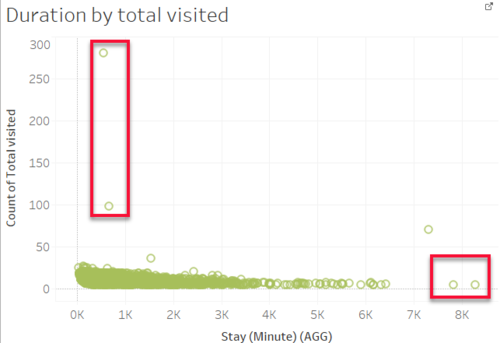
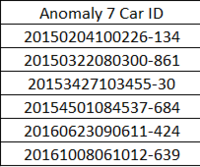
| 4.Abnormally high number of stops visited with low average duration
• 20150105060134-242, 20150420100416-232 visited 4 checkpoints but stayed for over one month in the reserve (Extended camper) |
|
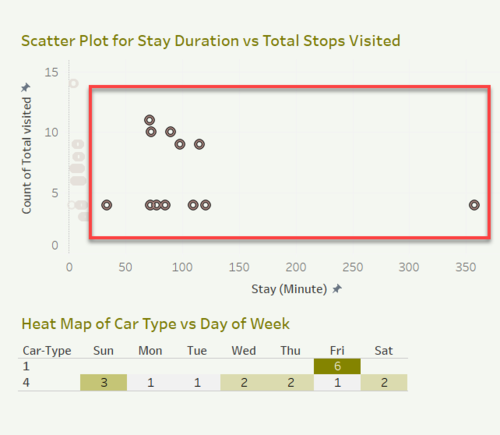
| 6.Hiking or sightseeing visitors with abnormally long stay in the park (they are the same group of visitors observed in 1)
|

