ISSS608 Sivagamy DATA PREPARATION
|
|
|
|
|
Contents
Data Description
The data file contains data recorded from sensors around the Boonsong Lekagul Nature Preserve. A map containing the locations of roadways and sensors throughout the Preserve is also shared to us. Traffic enters and exits the Preserve through official Entrances. There are several Campgrounds where both day-camping and overnight camping are allowed. There are certain roadways restricted to the Preserve Rangers only. The Preserve Rangers are monitoring traffic through various segments of the Preserve, so other sensors are found in various other locations.
Entry gates are positioned at the Preserve entrances. Each vehicle receives an entry ticket at the gate and is assigned a vehicle class, the entry is recorded. The entry ticket contains an RF-tag that enables the Preserve sensors to pick up the passage of a vehicle through the Preserve. Each vehicle surrenders their entry ticket when exiting the Preserve and the exit is recorded.
When vehicles enter the Preserve, they must proceed through a gate and obtain a pass. Vehicles receiving a pass with a P appended to their category are park service vehicles that have access to all parts of the Preserve. Currently, the Preserve vehicles are only 2 axle trucks, so they are designated as 2P vehicle type.
Preserve Map
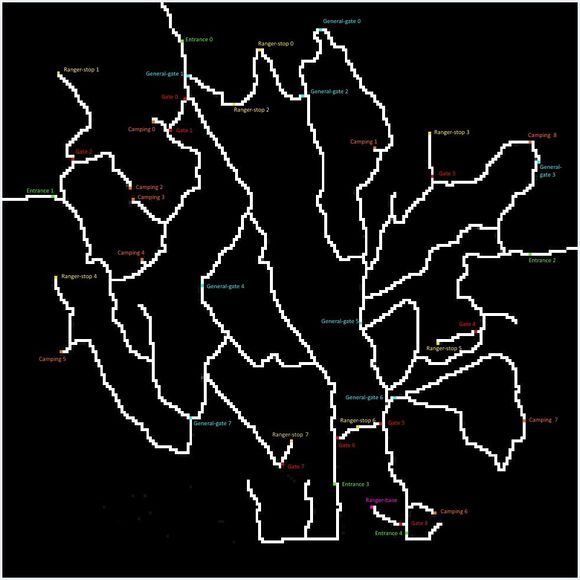
The map provided presents the Preserve in terms of a 200x200 gridded area. The grid is oriented with north at the top of the map. Grid location (0,0) is at the lower left corner of the map (the SW corner). They have superimposed both the roadways and the sensor locations on this grid. The map shows an area 12 miles x 12 miles.
Roadways are indicated by white colored pixels on the map. Each sensor type has its own unique color: Entrances (green), General-gates (blue), Gates (red), Ranger-stops (yellow), and Camping (orange).
| Gate Category | Gate Name |
|---|---|
| Camping | camping(0-8) |
| Entrance Gate | entrance(0-4) |
| General Gates | general-gate(0-7) |
| Gate | gate(0-8) |
| Ranger Stops | ranger-stop(0-7) |
| Ranger Base | ranger-base |
Table with gate details
The sensors are located at the different gates shown in the Preserve Map. There are as follows:
1. Entrances : All vehicles pass through an Entrance when entering or leaving the Preserve.
2. General-gates : All vehicles may pass through these gates. These sensors provide valuable information for the Preserve Rangers trying to understand the flow of traffic through the Preserve.
3. Gates : These are gates that prevent general traffic from passing. Preserve Ranger vehicles have tags that allow them to pass through these gates to inspect or perform work on the roadway beyond.
4. Ranger-stops : These sensors represent working areas for the Rangers, so you will often see a Ranger-stop sensor at the end of a road managed by a Gate. Some Ranger-stops are in other locations however, so these sensors record all traffic passing by.
5. Camping : These sensors record visitors to the Preserve camping areas. Visitors pass by these entering and exiting a campground.
Gate Co-ordinates
Though the map of the Boonsong Lekagul Nature Preserve was shared, the co-ordinates of the various gates in the preserve was unknown. Also, under the data field Car-type numbers from 1 to 6 were given, which needs to be renamed so it will be easy during data exploration visualization.
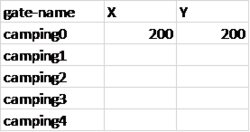
- Create an '.csv' file with all the distinct gate names of the preserve and then create two other columns X and Y and enter '200' as the first entry for both the columns as shown in figure 2.
- Load the given dataset into tableau
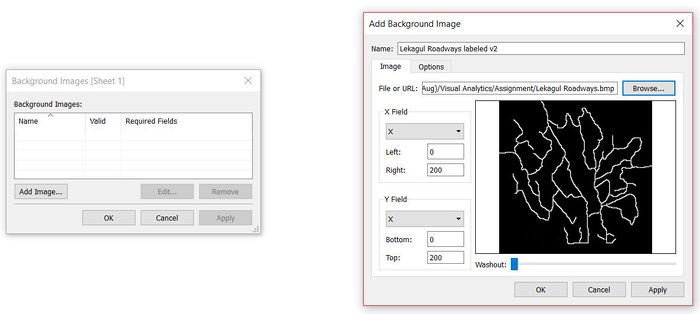
- To get the co-ordinates of the various gates, first load the image into tableau by on Map -> Background Images -> Dataset Name(Legakul Sensor Data)
- A window named Background Images will open click on Add button then choose the file location of the preserve map and enter click OK.
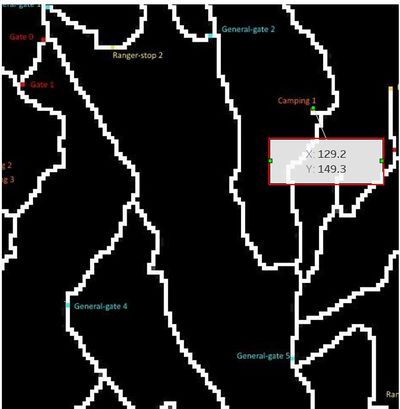
- Right Click on the gate point in the map and choose Annotate -> line-height
- Do the above steps to get the co-ordinates of all the other gates and enter the values in the X and Y column respectively in the '.csv' file created at step 1.
Join the original file and co-ordinates file
- In tableau load the co-ordinates file and use left join on gate type
Creating new variables
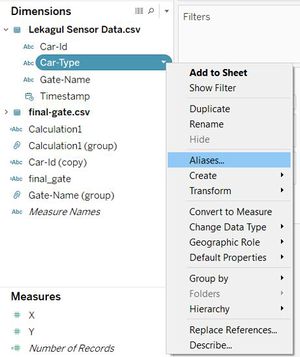
- All the car-type are given as numbers from 1 to 6 for which the explanation is given in the data description file. Click on the column car-type then choose 'Aliases' from the drop down list.
| Car type | Description |
|---|---|
| 1 | 2 axle car (or motorcycle) |
| 2 | 2 axle truck |
| 3 | 3 axle truck |
| 4 | 4 axle (and above) truck |
| 5 | 2 axle bus |
| 6 | 3 axle bus |
Table with car type description
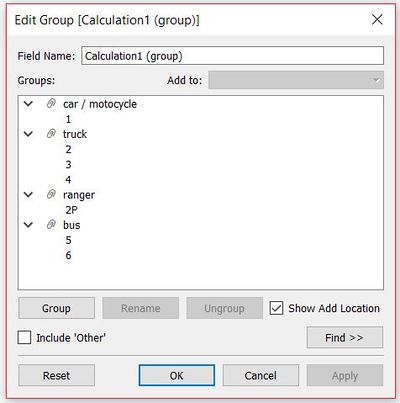
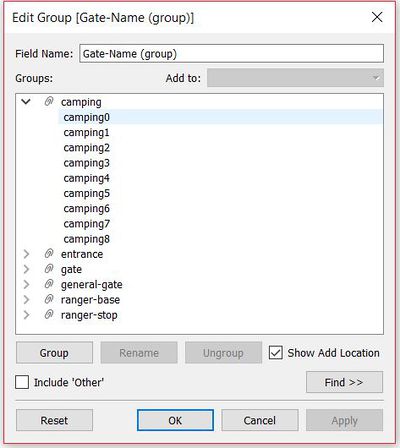
- Create 2 other columns by duplicating the columns car-type and Gate-name
- Now we are going to group the car types as shown below, click on the types you want to group then click on the 'group' button
- Now we are going to group the gate types as shown below, click on the types you want to group then click on the 'group' button
Create final gate
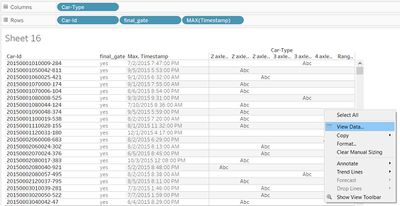
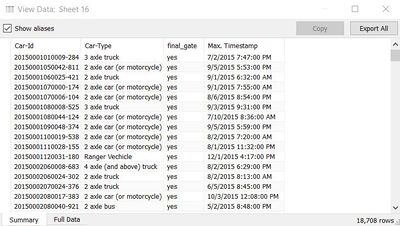
- Create another excel from the variables using Car_Type, max(timestamp) and create a column with 'Yes' as the default value. Right click on the table and select View data.
- In the pop up windown click on Export All
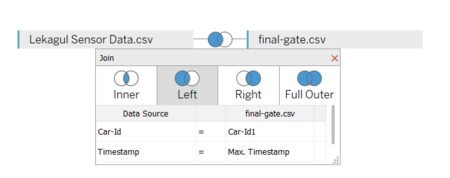
- Finally, join it with the main table again, which will give us Yes for the maximum timestamp of a car-id. Join the tables using Left join with the variables given in the screenshot below.

