Q2
|
|
|
|
|
|
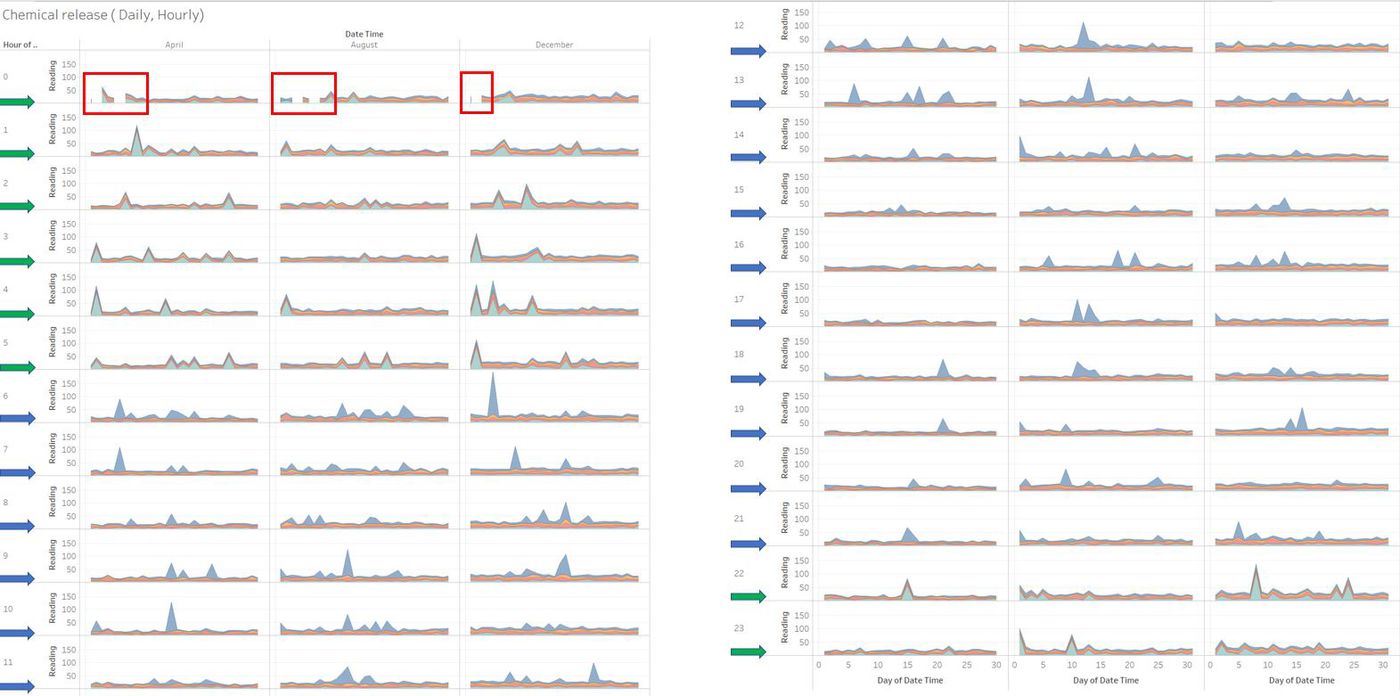
After finding excess readings captured by the monitors of AGOG-3A chemical and less of Methylosmolene, it is imperative to see if they were released in huge quantities. If yes, then we can deduce that the high release of AGOG in large number of quantity is affecting the habitat of the nature park. To analyse the release of chemicals and their readings, a stacked graph is drawn at regular hourly interval.
From the above chart it is very evident that there are no readings at 0th hour (12 AM) on few days of the month and this is in sync with our previous analysis on the sensor readings and its performance. The observations that can be drawn from the stacked graph is the release of chemicals at every hour. There is pattern here, every day of the three months excess of Methylosmolene is released from 10PM till 6AM and excess of AGOG-3A is released from 6AM to 9PM.

