ISSS608 2016-17 T3 Assign ZHANG JIAQI
Mini Challenge 2
Q1. Sensor performance
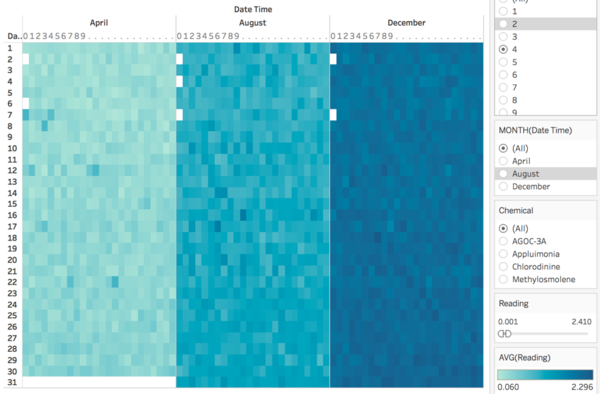
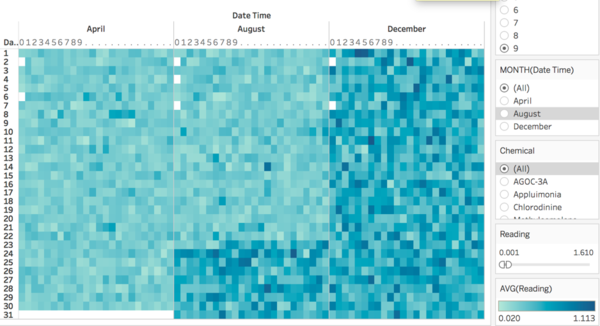
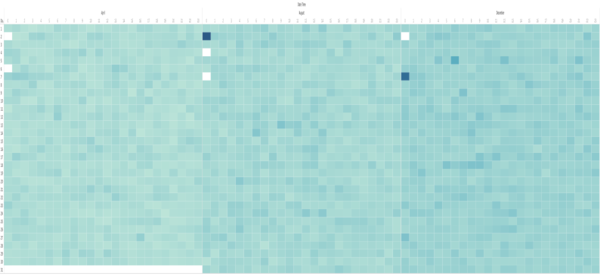
Monitor 3 has the most volatile readings which is unexpected. Monitor 1 and 2 are least volatile. Monitor 4 shows an increasing trend. 7 and 8 have normal volatility.
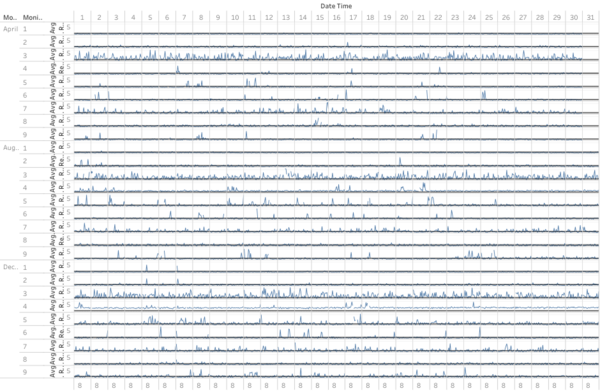
Monitor 4 and 9 show an increasing trend in the reading. This trend can be seen in all four chemicals.
All monitors do not have readings for 0 hour on 2,6 April, 4,7 August, and 2 December. 2 August and 7 December only have readings for certain chemical and certain sensor.
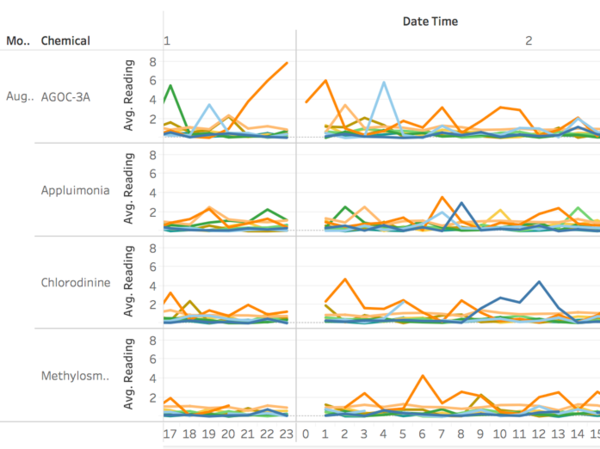
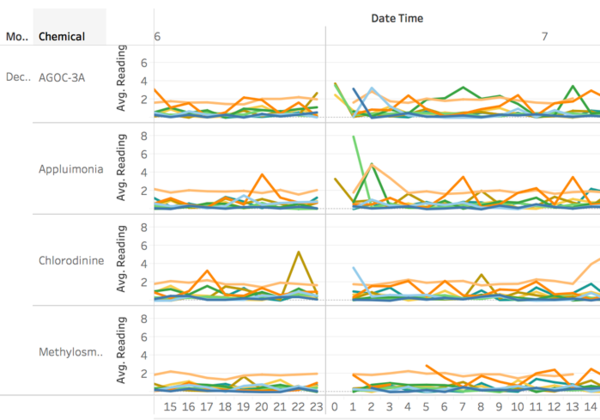
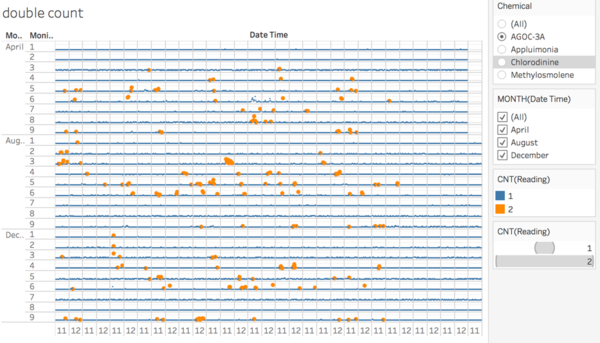
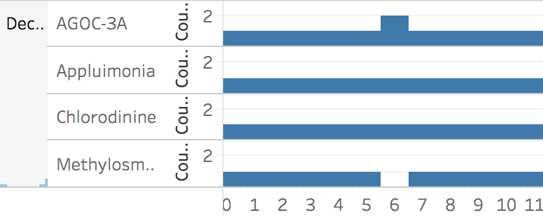
We realized some peaks are caused by double readings in chemical ‘AGOC-3A’, as there is a mistake of recording ‘Methylosmolene’ as ‘AGOC-3A’. Monitor 1 and and 2 do not have double readings in April. Monitor 7 and 8 do not have double readings in August and December.
The pattern of counting ‘AGOC-3A’ twice and ‘Methylosmolene’ 0 time can be seen in all the time marked by the orange points in the picture above.
