ISSS608 2016-17 T3 Assign DEBASISH BEHERA preparation
|
|
|
|
Tableau Public:
Question 1
Characterize the sensors’ performance and operation. Are they all working properly at all times? Can you detect any unexpected behaviors of the sensors through analyzing the readings they capture?
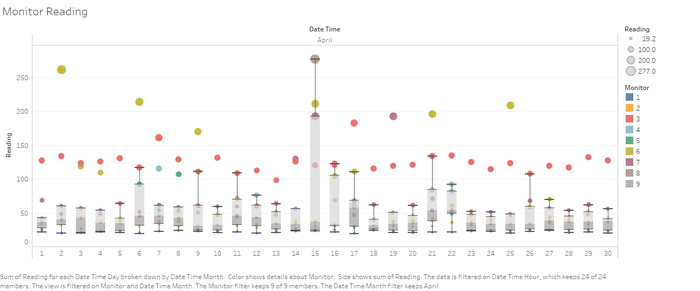
Month: April From the figure, monitor 3 and monitor 6 are consistently showing very high readings every day.
When we analyse the readings of all the monitor it shows that all the monitors are not showing proper reading at all the times of the day.
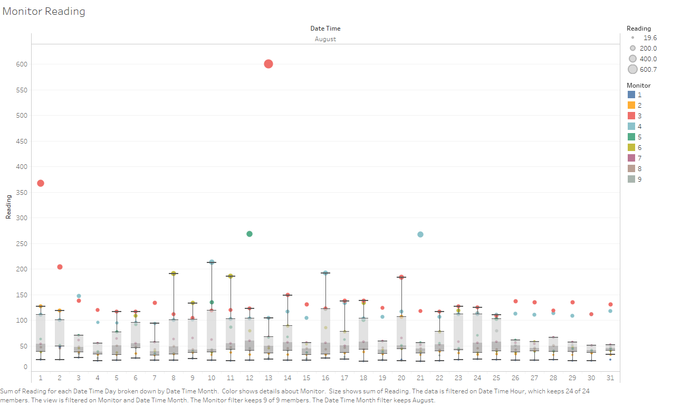
Month: August We notice that the readings are very high for the monitor 3,4 and 6. Monitor 3 is the one with the highest readings.
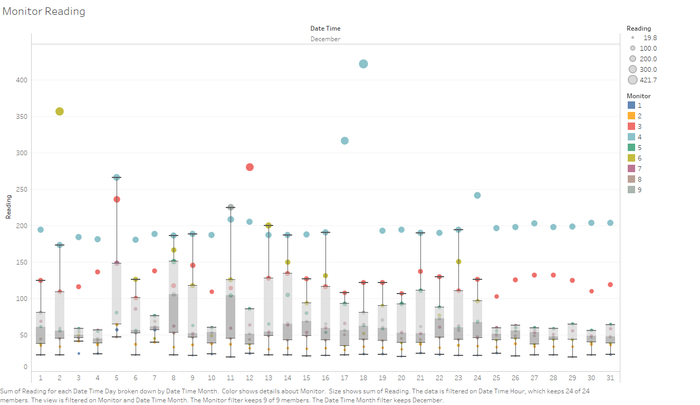
Month: December We notice that very high readings are showing for monitor 3,4 and 6. Monitor 4 is showing the highest reading.
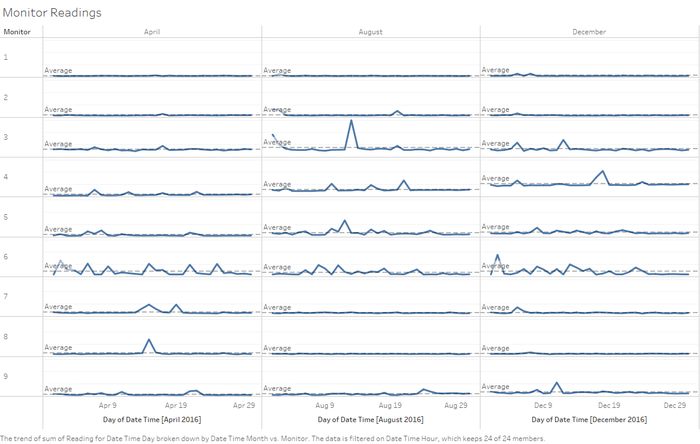
Now we look at the no of readings picked up by each of the sensors around the factory vicinity to find out why the readings are very high on certain months.
From the above figure, it is evident that the readings from monitor 3,4, 5 and 6 are consistently showing more than average readings throughout the 3 months’ period whereas monitor 1, 2 and 9 are showing consistent readings. Also, if we consider the readings of 7 and 8 there is some spike in the month of April but no spikes in the month of August and December.
Now let us see what are the no of records that are captured by each of the sensors since they should capture mostly equal no of readings.
From the readings obtained for the month of April, August and December it seems that whenever there is an increase in readings of chemical AGOC-3A there is a decrease in the readings of the chemical Methylosmolene. Conclusion: From the reading value and number of readings recorded it seems that Sensor 7 and 8 were showing different readings for the month of april for AGOC and Methylosmolene but in the month of August and December the readings were constant. For the sensors 3,4,5,6,9 the no of readings recorded by them seems to change a lot especially for the month of August whereas the no of readings from sensor 1 and 2 varies very little.
Q2
Which chemicals are being detected by the sensor group? What patterns of chemical releases do you see, as being reported in the data?
Q3
Which factories are responsible for which chemical releases? Carefully describe how you determined this using all the data you have available. For the factories you identified, describe any observed patterns of operation revealed in the data.


