ISSS608 2016-17 T3 Assign TEN KAO YUAN
Contents
Mini-Challenge 1 : Traffic Patterns of Life through the Preserve
Introduction We are required to analyze traffic data entering and exiting the Boonsong Lekagul Nature Preserve. Traffic enters and exits the Preserve through official Entrances. There are several Campgrounds where both day-camping and overnight camping are allowed. There are certain roadways restricted to the Preserve Rangers only. The Preserve Rangers are monitoring traffic through the preserve. Each vehicle travelling within the Preserve carries an RFID tag which produces a log each time the vehicle passes near sensors located at specific segments or gates located at various points of the Preserve.
Type of Gates
There are five types of Gates :
| Gate Type | Description |
|---|---|
| Entrances | All vehicles pass through an Entrance when entering or leaving the Preserve. |
| General-gates | All vehicles may pass through these gates. These sensors provide valuable information for the Preserve Rangers trying to understand the flow of traffic through the Preserve. |
| Gates | These are gates that prevent general traffic from passing. Preserve Ranger vehicles have tags that allow them to pass through these gates to inspect or perform work on the roadway beyond. |
| Ranger-stops | These sensors represent working areas for the Rangers, so you will often see a Ranger-stop sensor at the end of a road managed by a Gate. Some Ranger-stops are in other locations however, so these sensors record all traffic passing by. |
| Camping | These sensors record visitors to the Preserve camping areas. Visitors pass by these entering and exiting a campground. |
Types of Vehicles
When vehicles enter the Preserve, they must proceed through a gate and obtain a pass. The gate categorizes vehicles as follows:
- 2 axle car (or motorcycle)
- 2 axle truck
- 3 axle truck
- 4 axle (and above) truck
- 2 axle bus
- 3 axle bus
DATA PREPARATION
The sensor data set contains 171477 observations with 18708 unique vehicles IDs. The data set poses the following challenges:
- We are not given the gate coordinates on the map
- Each vehicle ID has it's own number of sequences of gates and time stamps
Gate Coordinates
A quick and dirty method to obtain the coordinates is to use Tableau's annotate utility. The 'Lekagul Roadways labeled v2' jpeg file is selected as a background image with a 200x200 grid and origin at the top left (note that this image's resolution is 982 x 982 pixels). Dummy measures A and B are created with value 200 and placed in the columns and rows respectively. These measures are required to display the background image properly. By right clicking a location on the image and selecting the 'Annotate' function, followed by Point, we are able to label a point on the grid corresponding to the desired location on the background image. By positioning the pointer of the annotation to a different position, we are able to read out the various coordinates of the different gates.
These are the coordinates that we obtained for the various gates.
| Gate Name | X Coordinate | Y Coordinate |
|---|---|---|
| camping0 | 53 | 158 |
Sequence Data
The sequence data can be analyzed using various methods to understand how the vehicles spend their time within the park. During the analysis, different methods were attempted with various degrees of success.
- Tabulation
- Sunburst Diagram
- Path Diagram
DATA EXPLORATION
We explore this data set to identify general patterns and trends. The challenge of this data set is that it requires both geo-spatial and temporal analysis of the path sequences of the vehicles travelling throughout the park. A general exploration of the data is conducted to get a feel of the dataset.
Temporal Exploration
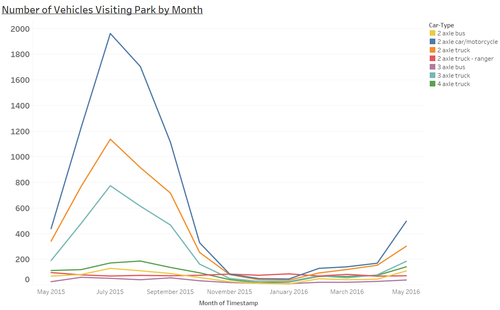
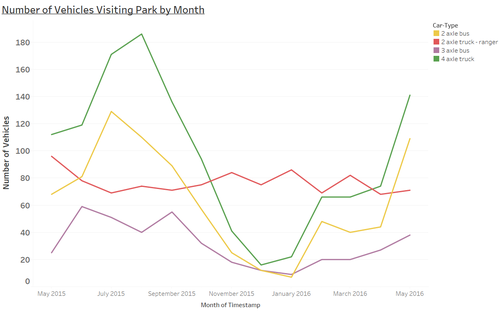
Plotting the number of vehicles by type and month, we observe that the park has a majority of visitors in from May to September. This indicates that the park would be located in the Northern Hemisphere as these corresponds to the warmer period of the year where there would be more wildlife to observe and more visitors (e.g. summer holidays). There is a peak in July for vehicles type 1, 2, and 3 (car, motorcycle, 2 and 3 axle truck). On the other hand the numbers of vehicles 4, 5, and 6 (4 axle truck and bus) reach a maximum in May. Interestingly, the number of 2P vehicles (park rangers) also reaches a peak during this period. A possible explanation is that visitors in vehicles 1, 2 and 3 are likelier to be leisure visitors who come and go independently when they please whereas vehicles 4, 5, and 6 are likelier to be utility vehicles servicing the park (provision of supplies, trash removal, etc.) or just passing through the park as part of their larger route (e.g. transport vehicles).
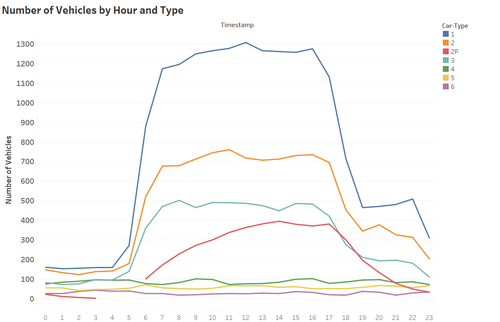
Similarly when plotting the number of vehicles by type and hour, we observe that the majority of the visits for vehicles type 1, 2 and 3 occur during the day between 7am and 7pm. This is unsurprising as the majority of park visitors would prefer to visit during the day when the flora and fauna are readily visible. Overnight campers are also likelier to stay put at night and travel around the park when it is bright for safety and practical reasons, hence their movement is only detected at the gates in the day. On the other hand the numbers of vehicles 4, 5 and 6 remain similar throughout the day. Given that the number remains steady throughout the day, it is much likelier that these vehicles are transport vehicles passing through the park instead of utility vehicles servicing the park. Utility vehicles would be more active in the day when typical service activities need to carried out whereas transport vehicles are likelier to travel at any time of the day to reach their destination. We also observe the number of ranger vehicles throughout the day - in general ranger vehicles are more active between 6am and 23pm.
Geospatial Exploration
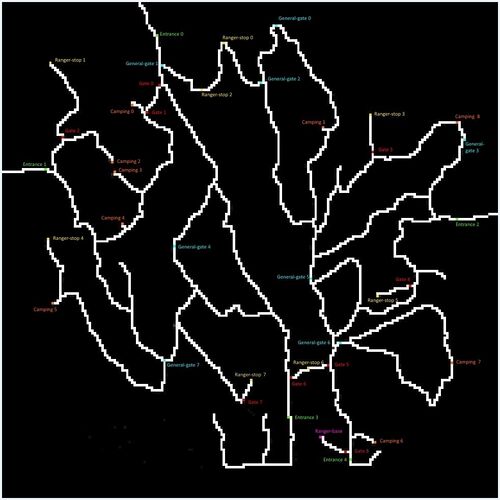
The different roadways running through the park are depicted in the map. There are 5 entrances into the park - Entrance 0 to the North West, Entrance 1 to the East, Entrance 2 to the West and Entrance 3 and 4 to the South. Based on information in Mini-Challenge 2, we know that there are factories located at the South of the park, near Entrance 3. All vehicles, except for park rangers, enter and exit the park via these entrances. All vehicles, except for park rangers, should begin and end their journey at one of the entrances.
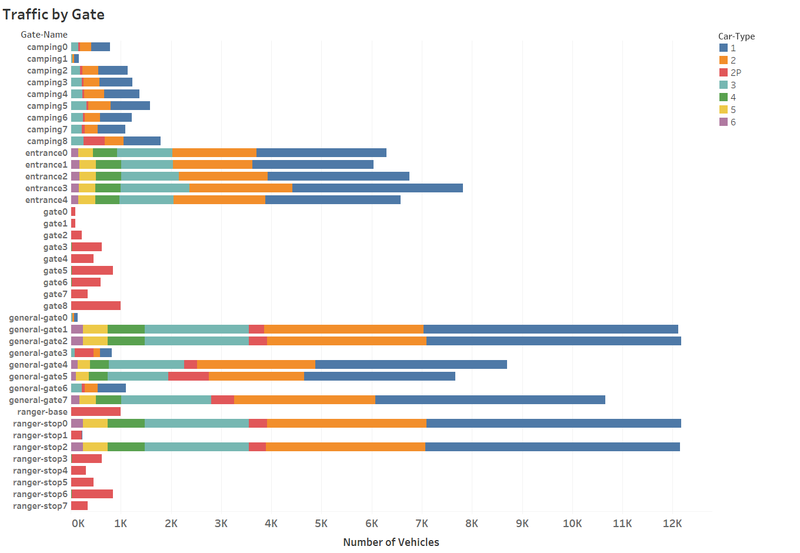
We observe roughly an equal number of vehicles going through the 5 entrances. There is no preferred entrance into the park. However, since there are 2 entrances at the South of the park, this indicates that there are more vehicles passing through the southern exits. This is possibly due to the presence of the factories. We can also speculate that there is a population center, probably Mistford, located to the south of the park as the factories would have access to labour. The number of vehicles passing through the camping sites is about a quarter the number of vehicles passing through the entrances. Even after accounting for the fact that each vehicle passes through an entrance twice (entering and exiting), the lower number of vehicles observed at the camp sites indicates that not all vehicles visiting the park stop at a camp site. The most popular gates are:
- General Gate 1
- General Gate 2
- General Gate 4
- General Gate 5
- General Gate 7
- Ranger Stop 0
- Ranger Stop 2
DAILY PATTERNS OF LIFE
Ranger Patrols
The first daily pattern identified is ranger patrols.
In Out Visits
Campers
LONG TERM PATTERNS OF LIFE
ANOMALIES
==


