ISSS608 2016-17 T3 Assign CHUA GIM HONG
|
|
|
|
|
VAST Challenge 2017 - Mystery of Rose-crested Blue Pipit bird at Boonsong Lekagul Nature Preserve
Individual Assignment - Mini-Challenge 3
Prepared by Chua Gim Hong
MAD (Mad About Data) Community - DataViz Clan
Contents
Background
Mistford is a mid-size city located to the southwest of a large nature preserve. The city has a small industrial area with four light-manufacturing endeavors.
Mitch Vogel is a post-doc student studying ornithology at Mistford College and has been discovering signs that the number of nesting pairs of the Rose-Crested Blue Pipit,
a popular local bird due to its attractive plumage and pleasant songs, is decreasing!
The decrease is sufficiently significant that the Pangera Ornithology Conservation Society is sponsoring Mitch to undertake additional studies to identify the possible reasons.
Mitch is gaining access to several datasets that may help him in his work, and he has asked you (and your colleagues) as experts in visual analytics to help him analyze these datasets.
For full details, please visit VAST Challenge 2017: Overview.
Current Situation
There were signs that the number of nesting pairs of the Rose-Crested Blue Pipit is decreasing.
Mitch Vogel faced difficulty trying to assess the extent of the possible problem contributed to the downfall of the poor Rose-crested Blue Pipit bird because:
a. While he was able to get around some of the nature preserve to study the bird, he was not able to cover the entire preserve with a car or on foot but because of the terrain and the vegetation.
b. Drones and air vehicles would scare the birds.
For more details on Mini-Challenge 3, please visit VAST Challenge 2017: Mini-Challenge 3.
Objective
To use visual analytics to analyze the multi-spectral image data of the Lekagul Preserve collected by the National Space Service and understand changes in the environment (e.g. flora) that are related to issues with the Rose-Crested Blue Pipit.
Dataset
The multi-spectral dataset files from the National Space Service show the same piece of the Lekagul Preserve as imaged by a satellite multispectral sensor that measures in six different bands (B1 – B6) over a few years in the following format:
• TIF files which are 8-bit, 6-band files with 651 rows and columns. Bands 1-6 are ordered by wavelength (shortest to longest wavelengths) B1=blue, B2=green, B3=red, B4=near-infrared, B5= short-wave infrared (SWIR) 1 and B6= short-wave infrared (SWIR) 2.
• ASCII files which are in comma-delimited format where each record is the pixel value for each band at that X, Y location.
Note:
X, Y origin is the upper left corner of the image. The X, Y locations are relative to the image itself and not a geo-coordinate on Earth..
So, X=0, Y=0 refers to the pixel in the upper left corner of the image. Similarly, the bottom right pixel is X=650, Y=650.
The sensor is a sensitive scientific instrument and the resulting images are optimized for measurement and are not simply “pictures”.
Image & Data Preparation
Table 2 shows the multi-spectral bands and their utility.
True colour is given by B3, B2, B1 --> RGB (see Table 1).
Other band combinations can also be mapped to the RGB image channels to create what are known as “false color” images.
Frequently used false-color images are (see Table 1):
• B4, B3, B2 --> RGB: can be useful in seeing changes in plant health.
• B5, B4, B2 --> RGB: can be used to show floods or newly burned land.
• B1, B5, B6 --> RGB: can differentiate between snow, ice and clouds.
| Band | True Color | Wavelength (nm) | Useful for image interpretation | False Color 1 | False Color 2 | False Color 3 |
|---|---|---|---|---|---|---|
| B1 | Blue | 450-520 | Penetrates water, shows thin clouds and general visible brightness. | - | - | Red |
| B2 | Green | 520-600 | Shows different types of plants and general visible brightness. | Blue | Blue | - |
| B3 | Red | 630-690 | Vegetation color and certain mineral deposits. | Green | - | - |
| B4 | Near Infrared (NIR) | 770-900 | Partially absorbed by water, sensitive to vegetation structure and chlorophyll. | Red | Green | - |
| B5 | Short-wave Infrared (SWIR) 1 | 1550-1750 | Completely absorbed by liquid water. Sensitive to moisture content of soil and vegetation; penetrates thin clouds. | - | Red | Green |
| B6 | Short-wave Infrared (SWIR) 2 | 2090-2350 | Insensitive to vegetation color or vigor, shows differences in soil mineral content. | - | - | Blue |
| - | - | - | False Colours’ Usefulness for image interpretation | can be useful in seeing changes in plant health. | can be used to show floods or newly burned land. | can differentiate between snow, ice and clouds. |
In other cases, it may be helpful to use ratios of different bands to assess vegetation health or detect anomalous signals.
The following frequently used ratios are used for change detection and analysis:
Normalized Difference Vegetation Index, NDVI = (B4 - B3) / (B4 + B3).
Visual or digital interpretation of the output image/raster created by NDVI is:
• -1 to 0 - Bright surface with no vegetation.
• +1 - represent vegetation.
Normalized Difference Water Index (NDWI) may refer to one of at least two remote sensing-derived indexes related to liquid water
(Reference: Normalized Difference Water Index (NDWI): https://en.wikipedia.org/wiki/Normalized_difference_water_index):
• One is used to monitor changes in water content of leaves, using near-infrared (NIR) and short-wave infrared (SWIR) wavelengths, proposed by Gao (1996):
NDWI(Leaves)=(NIR-SWIR)/(NIR+SWIR)=(B4-B5)/(B4+B5)
• Another is used to monitor changes related to water content in water bodies, using green and NIR wavelengths, defined by McFeeters (1996):
NDWI(Water)=(Green-NIR)/(Green+NIR)=(B2-B4)/(B2+B4)
When this index is plotted across the image frame, it is easy to distinguish between healthy vegetation and bare ground cover.
Visual or digital interpretation of the output image/raster created by NDWI is similar to NDVI:
• -1 to 0 - Bright surface with no vegetation or water content
• +1 - represent water content
Normalized Difference Building Index (NDBI) NDBI=(B5 - B4)/(B5 + B4)
Evaluating the data as various false-color or ratio images may allow you to identify interesting features within the images that change over time and could help Mitch understand any potential changes that could be happening in the Lekagul Preserve.
It is common to apply different contrast stretch techniques to highlight certain brightness values and minimize others.
Also note that apparent differences in brightness can occur between dates due to changes in sun angle and atmospheric conditions.
When comparing images from different days and seasons, it is important to keep in mind that the values of specific pixels can change due to a number of factors including
• Clouds
• Atmospheric conditions (e.g. increased dust or aerosols in the air)
• Ground cover changes (e.g. plant growth between spring and summer)
• Sensor artefacts (e.g. bad pixels due to sensor failure or electronic noise)
• Contrast Stretching (e.g. the values of the pixels may have been enhanced so that when they are mapped into images they “stretch” to the full range of values 0-255)
Question 1
Boonsong Lake resides within the preserve and has a length of about 3000 feet (see the Boonsong Lake image file).
The image of Boonsong Lake is oriented north-south and is an RGB image (not six channels as in the supplied satellite data).
Please limit your answer to 3 images and 500 words.
Using the Boonsong Lake image as your guide, analyze and report on the scale and orientation of the supplied satellite images.
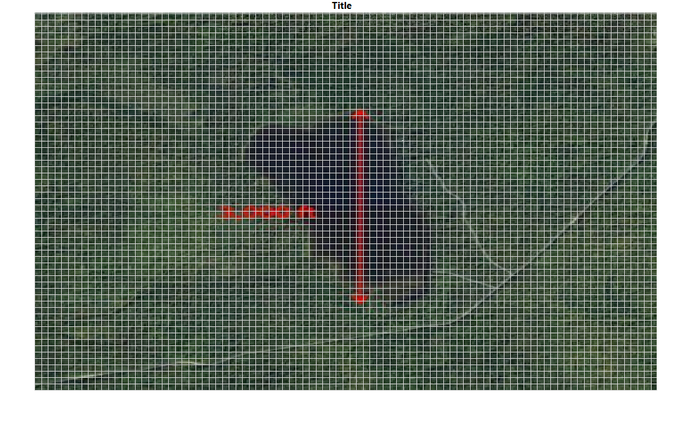
The RGB image of Boonsong Lake read into JMP Pro Graph Builder, with each grid line along X and Y axes set to be 1 pixel size.
There are 30 grid squares or pixels along the vertical distance of 3,000 feet (see red arrow in Figure 1).
Therefore, the scale of the supplied satellite images is 30 pixels : 3,000 feet or 1 pixel : 100 feet.
Figure 1: RGB image of Boonsong Lake in JMP Pro Graph Builder
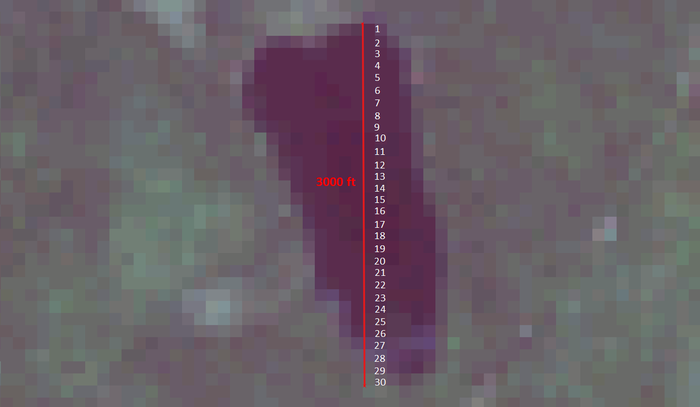
One of the TIF satellite images (image11_2016_09_06.tif) was opened in QGIS to locate Boonsong Lake.
It confirmed that the scale of the TIF satellite images was 30 pixels : 3,000 feet or 1 pixel : 100 feet (see Figure 2).
Since the orientation of the RGB image of Boonsong Lake was given as north-south, the TIF satellite images were also oriented north-south.
Figure 2: PNG image of Boonsong Lake exported from “image11_2016_09_06.tif” file in QGIS
How much area is covered by a pixel in these images?
The area covered by a pixel is 100 feet by 100 feet or 10,000 square feet.
Question 2
Identify features you can discern in the Preserve area as captured in the imagery.
Focus on image features that you are reasonably confident that you can identify (e.g., a town full of houses may be identified with a high confidence level).
Please limit your answer to 6 images and 500 words.
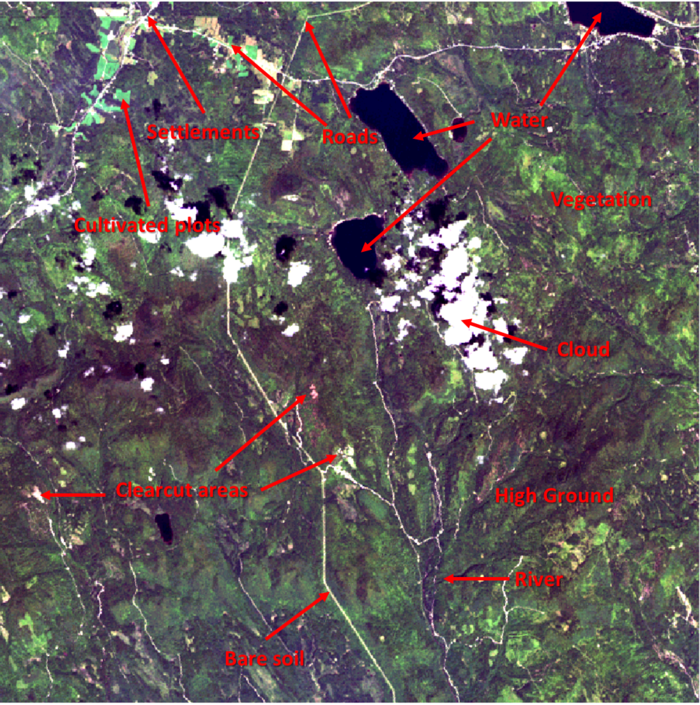
Figure 3 is produced from a "true colour" combination using B3, B2, B1 --> RGB.
The colours of this resulting composite image resemble closely what would be observed by the human eyes (Reference: http://www.crisp.nus.edu.sg/~research/tutorial/opt_int.htm).
In this display scheme, we could identify
• vegetation appears in shades of green.
• cultivated plots has luminous bright shades of green and defined shape.
• bare soils, clear-cut, roads/tracks and roadside settlements areas appear whitish.
• water feature and cloud shadows appear dark blue.
Figure 3: image11_2016_09_06 (processed using B3, B2, B1 --> RGB)
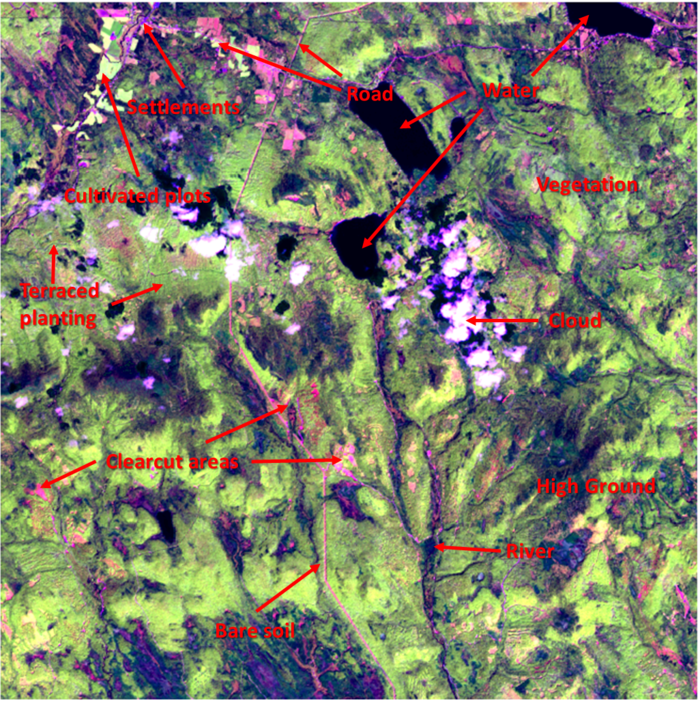
Figure 4, which was produced from a "false colour" combination using B5, B4, B2 --> RGB, was able to identify the above features more clearly
(Reference: http://www.crisp.nus.edu.sg/~research/tutorial/opt_int.htm):
• vegetation appears in shades of green.
• cultivated plots has luminous lighter shades of green and defined shape.
• bare soils, clear-cut, roads/tracks and roadside settlements areas appear in shades of pink.
• water feature and cloud shadows appear dark blue.
Figure 4: image11_2016_09_06 (processed using B5, B4, B2 --> RGB)
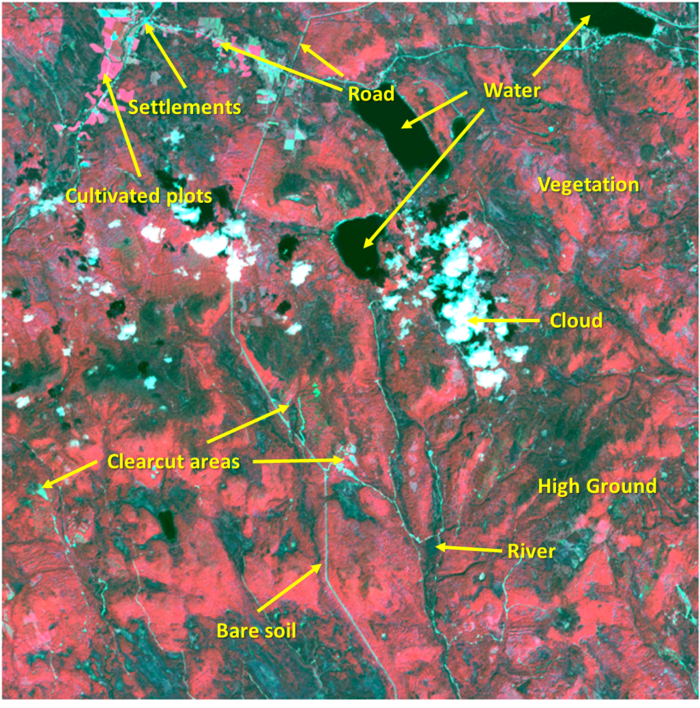
Figure 5: image11_2016_09_06 (B4, B3, B2), which was produced from a "false colour" combination using: B4, B3, B2--> RGB, further confirmed the identification of the above features
(Reference: http://www.crisp.nus.edu.sg/~research/tutorial/opt_int.htm):
• vegetation appears in shades of red depending on the types and conditions of the vegetation, since it has a high reflectance in the NIR band.
Healthy vegetation is brighter red and stressed vegetation is dark red (Reference: Page 16 of https://pubs.usgs.gov/of/2017/1034/ofr20171034.pdf).
• Clear water appears dark-bluish (higher green band reflectance).
• Bare soils, roads and buildings may appear in various shades of blue, yellow or grey, depending on their composition.
Figure 5: image11_2016_09_06 (processed using B4, B3, B2 --> RGB)
Question 3
There are most likely many features in the images that you cannot identify without additional information about the geography, human activity, and so on.
Mitch is interested in changes that are occurring that may provide him with clues to the problems with the Pipit bird.
Identify features that change over time in these images, using all channels of the images.
Changes may be obvious or subtle, but try not to be distracted by easily explained phenomena like cloud cover.
Please limit your answer to 6 images and 750 words.
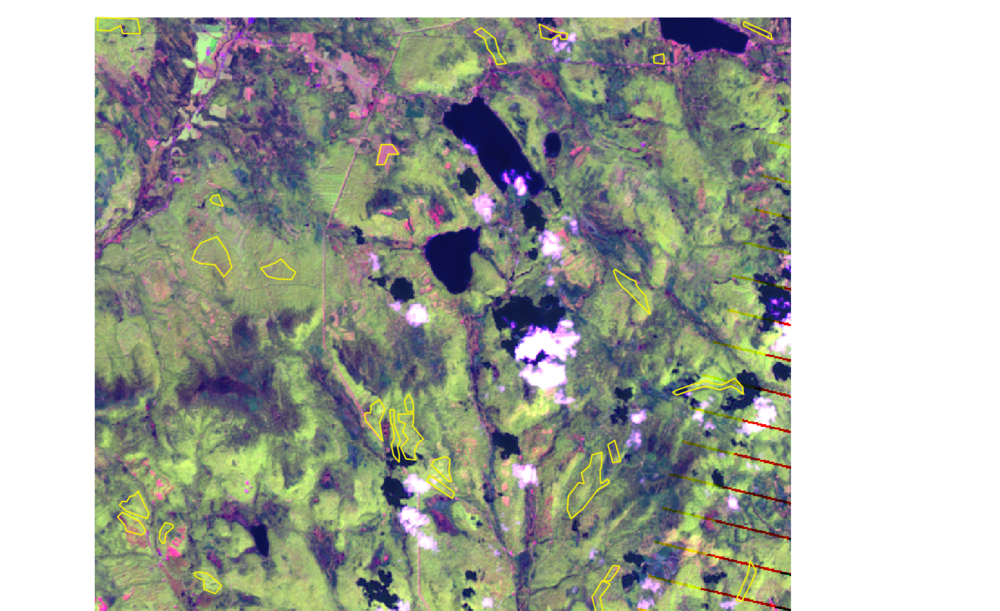
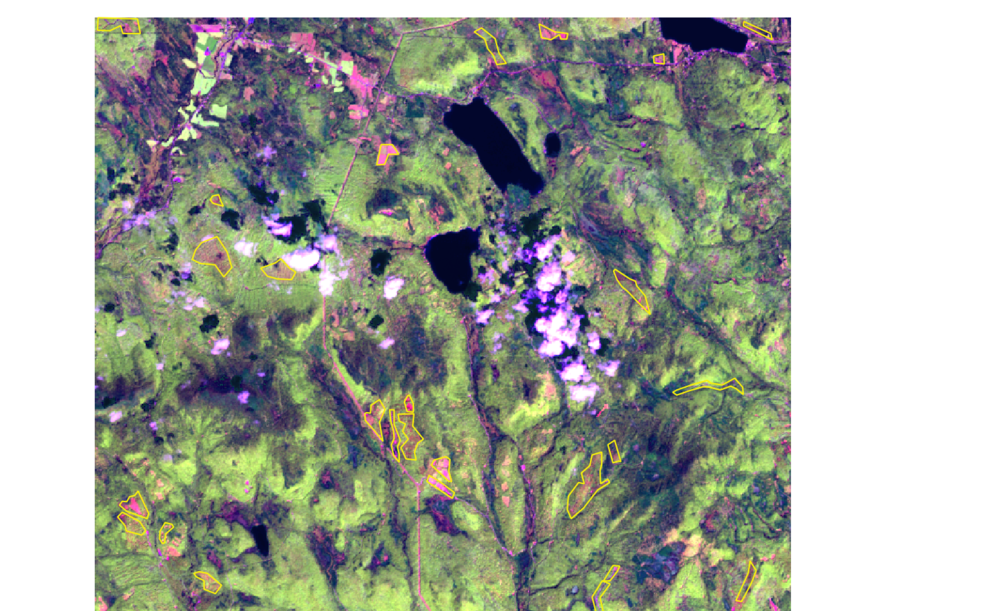
From Aug 2014 (Figure 6a) to Sep 2016 (Figure 6b), there is an increase in soils, clear-cut, roads/tracks and roadside settlements areas as shown in yellow polygons around the shades of pink.
Figure 6a: image02_2014_08_24 (processed using B5, B4, B2 --> RGB)
Figure 6b: image11_2016_09_06 (processed using B5, B4, B2 --> RGB)
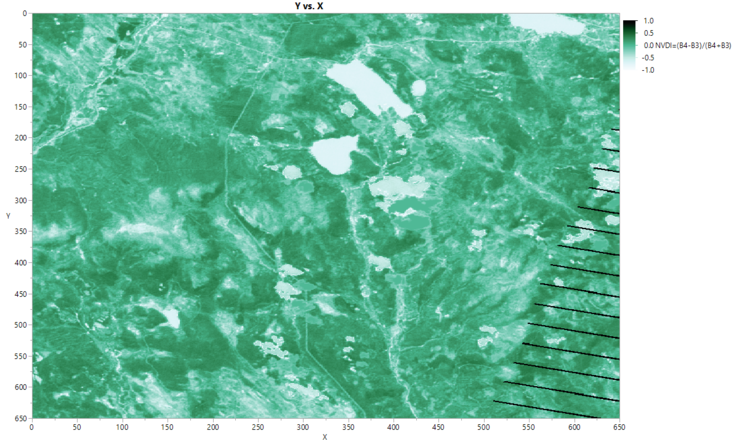
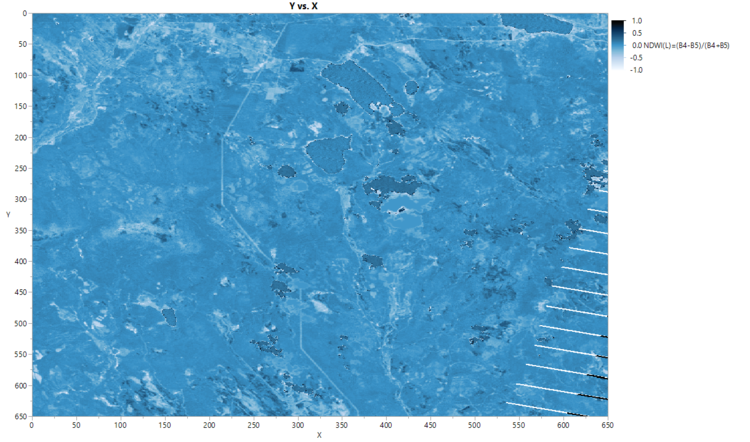
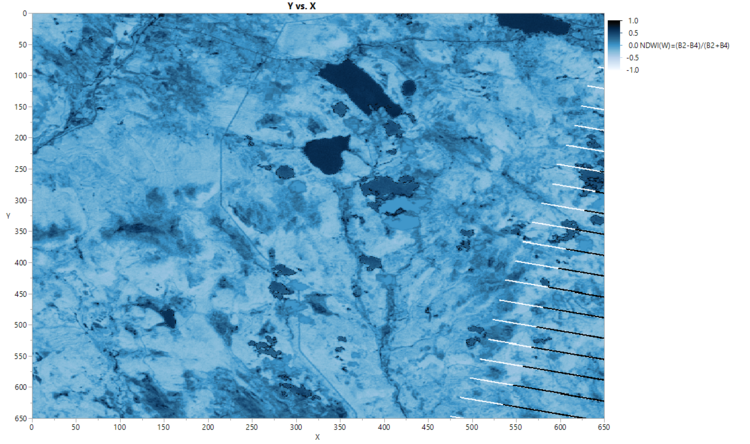
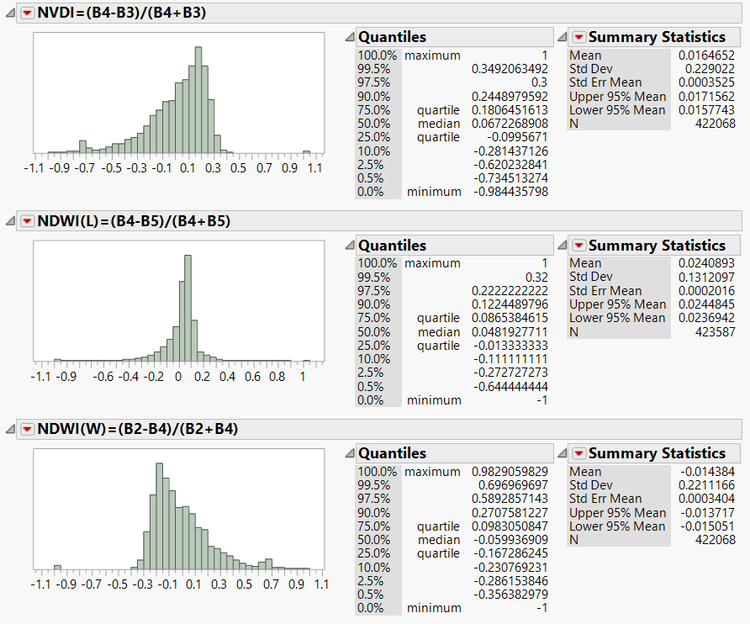
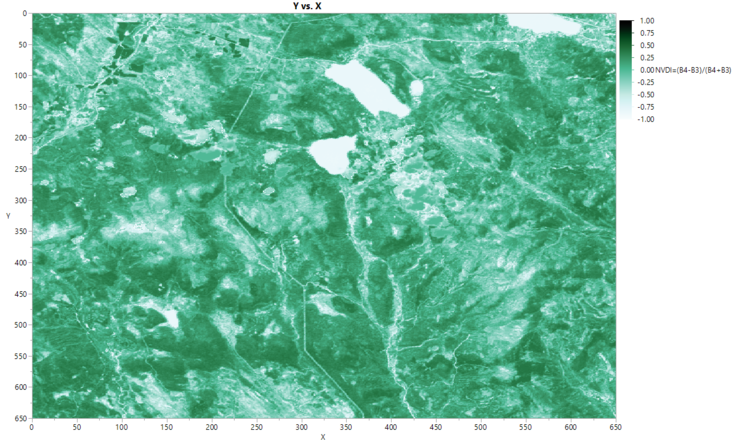
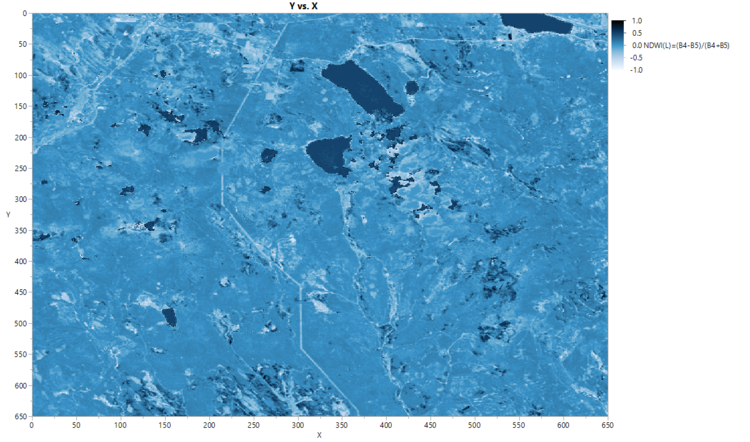
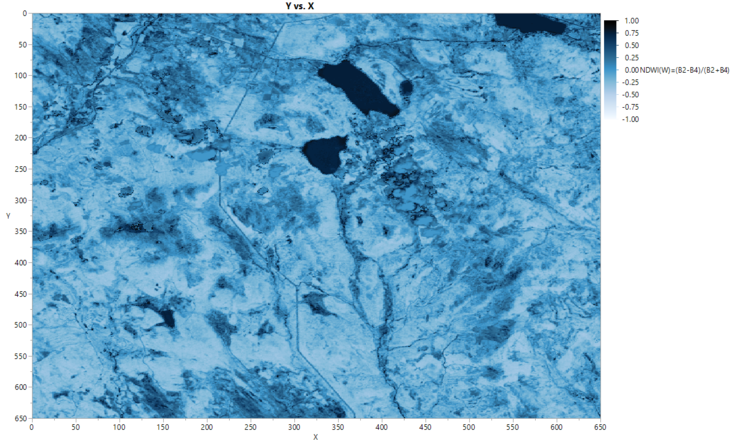
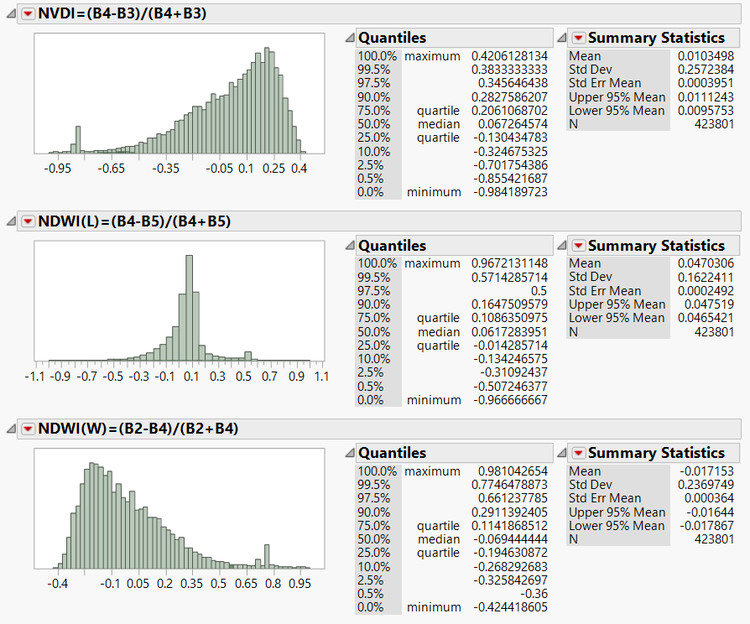
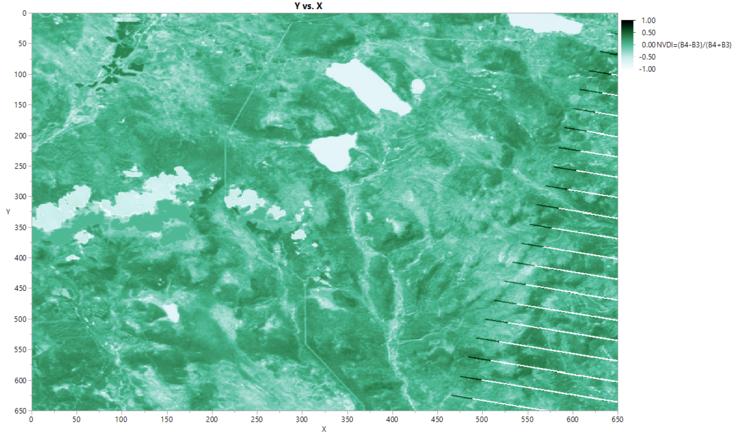
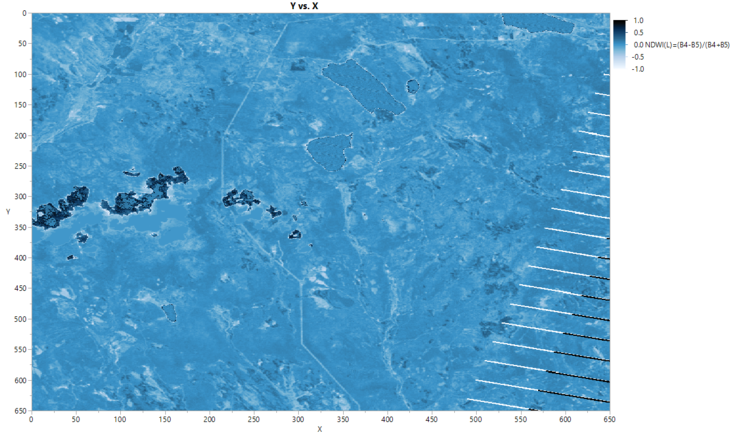
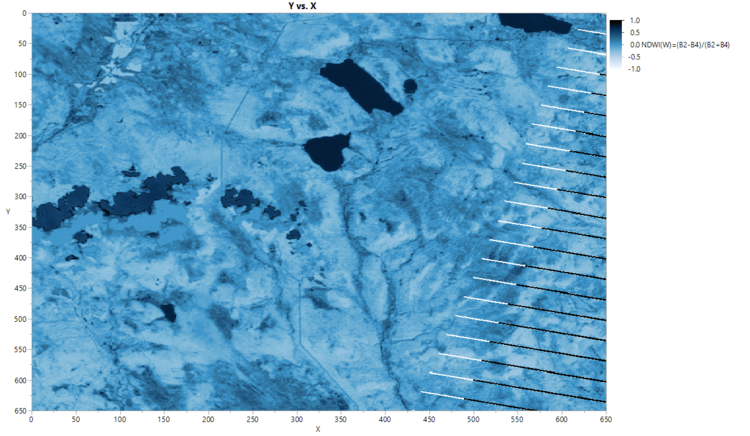
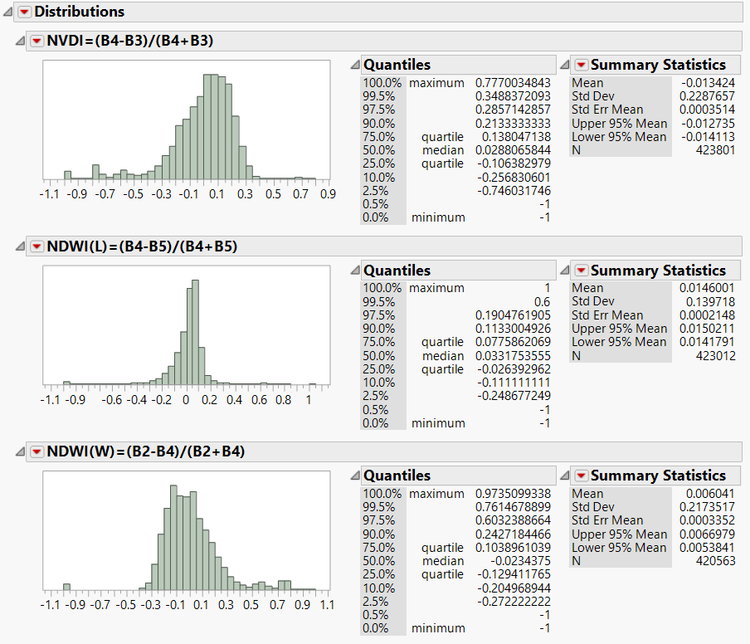
However, overall there is not very significant changes in vegetation and water availability in the Lekagul Preserve as shown in the NDVI and NDWI images (see Figures 7a and 7b).
Figure 7a(1): image02_2014_08_24 processed using NDVI
Figure 7a(2): image02_2014_08_24 processed using NDWI(Leaves)
Figure 7a(3): image02_2014_08_24 processed using NDWI(Leaves)
Figure 7a(4): Statistical Analysis of image02_2014_08_24 processed using NDVI, NDWI(Leaves) and NDWI(Water)
Figure 7b(1): image11_2016_09_06 processed using NDVI
Figure 7b(2): image11_2016_09_06 processed using NDWI(Leaves)
Figure 7b(3): image11_2016_09_06 processed using NDWI(Water)
Figure 7b(4): Statistical Analysis of image11_2016_09_06 processed using NDVI, NDWI(Leaves) and NDWI(Water)
Even in the driest part of the year from months of Jun to Sep (probably due to Summer season just over), there was availability water although some level of decrease not at critical levels was seen (see Figure 8):
Figure 8a: image07_2015_09_12 processed using NDVI
Figure 8b: image07_2015_09_12 processed using NDWI(Leaves)
Figure 8c: image07_2015_09_12 processed using NDWI(Water)
Figure 8d: Statistical Analysis of image07_2015_09_12 processed using NDVI, NDWI(Leaves) and NDWI(Water)
Deductions
The increase in soils, clear-cut, roads/tracks and roadside settlements areas from Aug 2014 to Sep 2016 (as shown in yellow polygons around the shades of pink in images image02_2014_08_24 and image11_2016_09_06 processed using B5, B4, B2 --> RGB respectively), were evidence of an increase in human activities and vehicular traffic in the Lekagul Preserve. These has yet to cause very significant changes in vegetation and water availability in the Lekagul Preserve, as shown in the NDVI and NDWI processed images (see Figures 7a and 7b). The human activities would probably be disruptive to the tranquility of the Lekagul Preserve. That would in turn affect the living habitat of the Rose-crested Blue Pipit bird.
Conclusion
It was probable that the number of nesting pairs of the Rose-Crested Blue Pipit was decreasing due to disruption caused by the increase human activities in the Lekagul Preserve. More information and data would be needed to confirm this e.g. higher resolution satellite images, types of human activities, botany, noise levels, geography, temperature, humidity and so on.
References
- [placeholder]

