ISSS608 2016-17 T3 Assign TEN KAO YUAN
Contents
Mini-Challenge 1 : Traffic Patterns of Life through the Preserve
Introduction We are required to analyze traffic data entering and exiting the Boonsong Lekagul Nature Preserve. Traffic enters and exits the Preserve through official Entrances. There are several Campgrounds where both day-camping and overnight camping are allowed. There are certain roadways restricted to the Preserve Rangers only. The Preserve Rangers are monitoring traffic through the preserve. Each vehicle travelling within the Preserve carries an RFID tag which produces a log each time the vehicle passes near sensors located at specific segments or gates located at various points of the Preserve.
Type of Gates
There are five types of Gates :
| Gate Type | Description |
|---|---|
| Entrances | All vehicles pass through an Entrance when entering or leaving the Preserve. |
| General-gates | All vehicles may pass through these gates. These sensors provide valuable information for the Preserve Rangers trying to understand the flow of traffic through the Preserve. |
| Gates | These are gates that prevent general traffic from passing. Preserve Ranger vehicles have tags that allow them to pass through these gates to inspect or perform work on the roadway beyond. |
| Ranger-stops | These sensors represent working areas for the Rangers, so you will often see a Ranger-stop sensor at the end of a road managed by a Gate. Some Ranger-stops are in other locations however, so these sensors record all traffic passing by. |
| Camping | These sensors record visitors to the Preserve camping areas. Visitors pass by these entering and exiting a campground. |
Types of Vehicles
When vehicles enter the Preserve, they must proceed through a gate and obtain a pass. The gate categorizes vehicles as follows:
- 2 axle car (or motorcycle)
- 2 axle truck
- 3 axle truck
- 4 axle (and above) truck
- 2 axle bus
- 3 axle bus
DATA EXPLORATION
Our Data set contains 171477 observations. We explore this data set to identify general patterns and trends. The challenge of this data set is that it requires both geo-spatial and temporal analysis of the path sequences of the vehicles travelling throughout the park. A general exploration of the data is conducted to get a feel of the dataset.
Temporal Hotspots
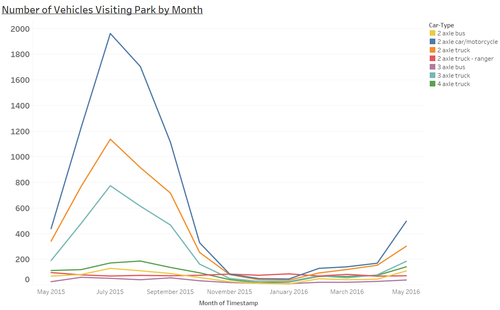
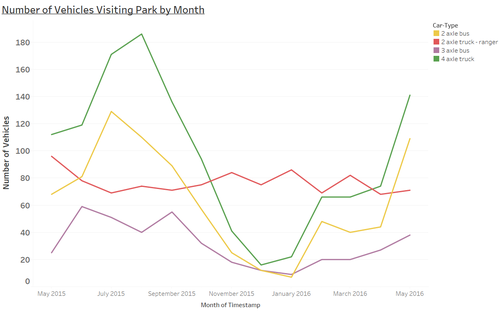
We observe that the park has a majority of visitors in from May to September. This indicates that the park would be located in the Northern Hemisphere as these corresponds to the warmer period of the year where there would be more wildlife to observe and more visitors (e.g. summer holidays). There is a peak in July for vehicles type 1, 2, and 3 (car, motorcycle, 2 and 3 axle truck). On the other hand the numbers of vehicles 4, 5, and 6 (4 axle truck and bus) reach a maximum in May. Interestingly, the number of 2P vehicles (park rangers) also reaches a peak during this period.
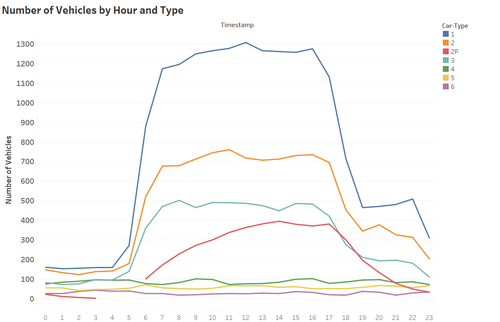
Similarly, we observe that the majority of the visits for vehicles type 1, 2 and 3 occur during the day between 5am and 7pm. This is unsurprising as the majority of park visitors would prefer to visit during the day when the flora and fauna are readily visible. Overnight campers are also likelier to travel around the park when it is bright for safety and practical reasons. On the other hand the numbers of vehicles 4, 5 and 6 remain similar throughout the day. We also observe the number of ranger vehicles throughout the day - in general ranger vehicles are active between 6am and 23pm.
Geospatial Hotspots
DAILY PATTERNS OF LIFE
Ranger Patrols
In Out Visits
Campers
LONG TERM PATTERNS OF LIFE
ANOMALIES
==


