Uncategorised files
Jump to navigation
Jump to search
Showing below up to 50 results in range #2,041 to #2,090.
View (previous 50 | next 50) (20 | 50 | 100 | 250 | 500)
 Timeline G4.png 1,660 × 885; 221 KB
 Toc.jpg 653 × 306; 11 KB
 Toc2.jpg 277 × 40; 4 KB
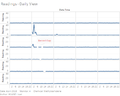
 Top 3 days.png 887 × 735; 103 KB
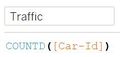 TrafficVariable.jpg 218 × 103; 4 KB
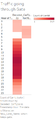 Traffic Pattern Gate.png 352 × 761; 25 KB
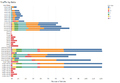 Traffic by Gate.png 1,360 × 940; 70 KB
 Traffic size by weekdays.png 1,448 × 800; 100 KB
 Traffic size by weekdays2.png 1,449 × 800; 87 KB
 TreeMapDemo.png 1,133 × 479; 102 KB
 TreeMapDemo1.png 1,032 × 435; 79 KB
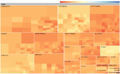 Treemap.jpg 1,256 × 772; 70 KB
 TreemapCritic.png 1,123 × 603; 115 KB
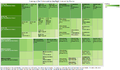 Treemap of the 4 chemicals by Day Night and by Monitor.png 1,096 × 642; 139 KB
 Trellis-Count.png 808 × 559; 35 KB
 Trellis-Reading.png 654 × 523; 44 KB
 Trellis-Reading (bar).png 804 × 524; 30 KB
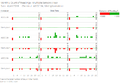
 Trellis pandemic.jpg 1,426 × 743; 121 KB
 Type(erse).png 118 × 148; 3 KB
 Unusual1.jpg 2,758 × 688; 286 KB
 Unusual2.jpg 2,536 × 1,729; 574 KB
 Unusual3.jpg 1,236 × 788; 118 KB
 Unusual4.jpg 1,060 × 738; 121 KB
 Unusual Pattern 1.png 943 × 735; 188 KB
 Unusual Pattern 2.png 947 × 729; 189 KB
 Unusual Pattern 3.png 959 × 765; 201 KB
 Unusual Pattern 4.png 907 × 735; 191 KB
 Unusual pattern for 3 something truck.png 1,162 × 976; 273 KB
 Unusual pattern for Car Motor.png 1,164 × 979; 258 KB
 UserSelection.gif 1,200 × 599; 5.32 MB
 VAA module.jpg 1,375 × 792; 177 KB
 VA Poster Group1.jpg 7,016 × 9,933; 7.97 MB
 VM3 hourly date Combined field.png 1,134 × 884; 389 KB
 VMAdding XY coords to rest of dataset.png 3,022 × 1,556; 627 KB
 VMColour horizon bands.png 990 × 906; 157 KB
 VMCombining sensor and weather.png 2,492 × 1,626; 518 KB
 VMDate Extract.png 1,732 × 630; 79 KB
 VMDatepart hour.png 1,734 × 622; 75 KB
 VMDirection angle bearing.png 2,514 × 818; 290 KB
 VMExtracted data.png 2,272 × 1,554; 865 KB
 VMFactory sensor locations.png 1,542 × 954; 335 KB
 VMHour Interval Bins.png 1,742 × 628; 145 KB
 VMHour Interval String.png 1,726 × 614; 118 KB
 VMMissing wind data.png 2,000 × 1,896; 226 KB
 VMQuestion 1 - missing data.png 2,000 × 1,896; 413 KB
 VMReadings from factories.jpeg 2,000 × 1,896; 246 KB
 VMReadings from other places.jpeg 2,000 × 1,896; 153 KB
 VMSlope graph Q3.jpeg 3,476 × 1,606; 268 KB
 VMSlope graph Wind Bin.jpeg 1,600 × 678; 214 KB
 VMWide form data.png 2,584 × 1,832; 788 KB


.png)

.png)


