ISSS608 2016-17 T3 Assign ASMIT ADGAONKAR
MC2.1 – Characterize the sensors’ performance and operation. Are they all working properly at all times? Can you detect any unexpected behaviours of the sensors through analysing the readings they capture? Limit your response to no more than 9 images and 1000 words.
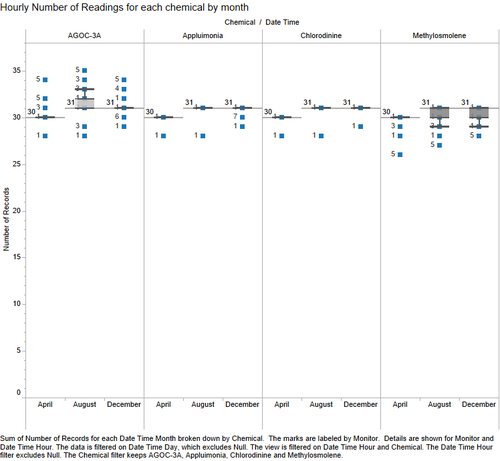
With the help of a boxplot of the hourly number of readings for each chemical each month, we can see a pattern in the aberration of sensor performance and operations.
It can be seen that Monitor# 5 has failed to collect readings for Methylosmolene at 12 pm in April, 6 am in August and at 8 am in December. In contrast, the monitor has actually gone on to record those numbers and assign it to AGOC-3A chemical. A further investigation for this matter can be demanded to analyze the sensor logs and understand the manner in which sensors are designed to collect readings. Wind speed and wind direction can also be looked at these times to see if that has any influence on this flaw of sensor operation. Last but not the least, this particular behavior of showing overweight on AGOC and underweight on Methylosmolene should also portrayed on the big picture of whether the companies are any reason behind the tampering of the readings. Are these companies tampering the sensor to stay in compliance of the pollutant readings?
