ISSS608 2016-17 T3 Assign GUAN YIFEI
|
|
|
|
|
To be a Visual Detective
The assignments require you to put the concepts, methods and techniques you had learned in class to solve real world problem using visual analytics techniques. Students should also use the assignments to gain hands-on experience on using the data visualisation toolkits I had shared with you to complate the assignment.
The assignment topics are based on VAST Challenge 2017. You are required to choose one of the challenge topic provided below and work out the solution.
Overview
Mini Challenge 1
Background
What you need to know?
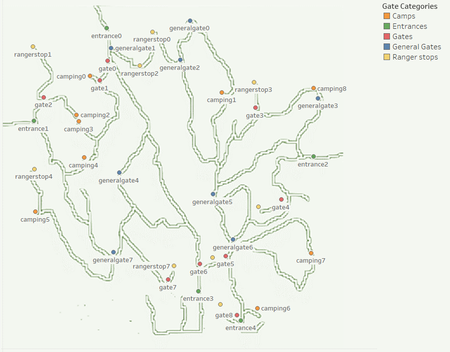
1. The Gates
2. The time
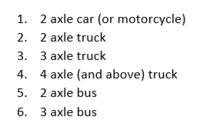
3. The Cars
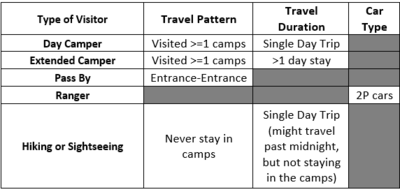
4. The Visitors The visitors were segmented as follows based on the nature of their movements in the reserve.
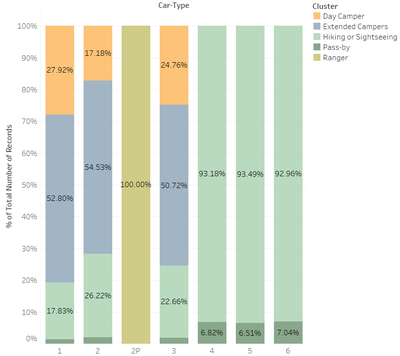
The graph below shows the composition of each cluster by car types.
5. The Data Timestamp: the date and time the sensor reading was taken Car-id: the assigned car ID from the entry gate Car-type: Vehicle type as enumerated above. “P” is appended when it is a park vehicle. Gate-name: name of the sensors taking the reading. See the map.
6. The Reserve


