Difference between revisions of "ISSS608 2016-17T3 Group15 Application"
Jump to navigation
Jump to search

| Line 43: | Line 43: | ||
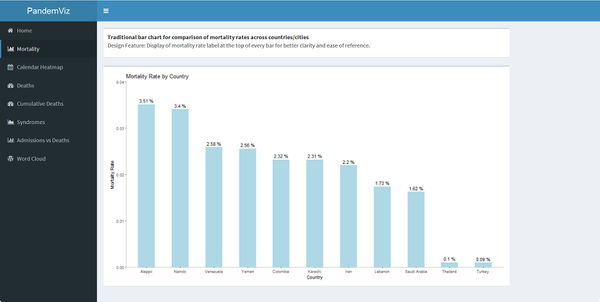
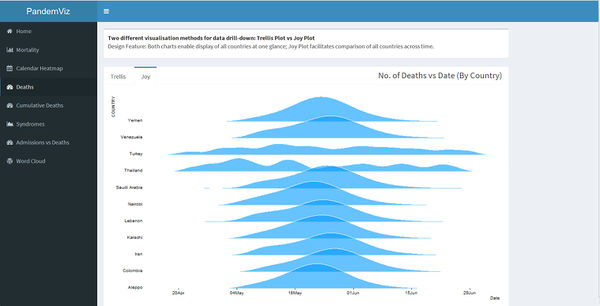
<center>[[File:Gp15dashboard1.jpg|600px]]</center> | <center>[[File:Gp15dashboard1.jpg|600px]]</center> | ||
| + | |||
| + | |||
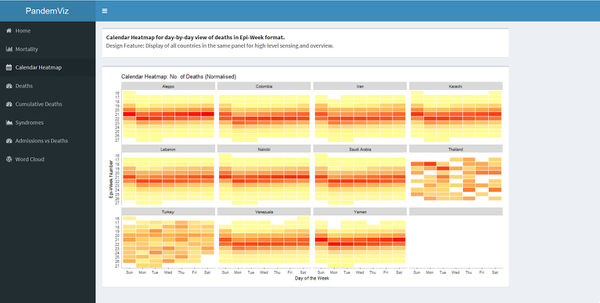
| + | <center>[[File:G15dashboard8.jpg|600px]]</center> | ||
| Line 61: | Line 64: | ||
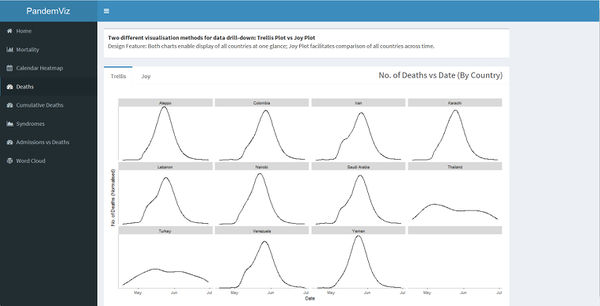
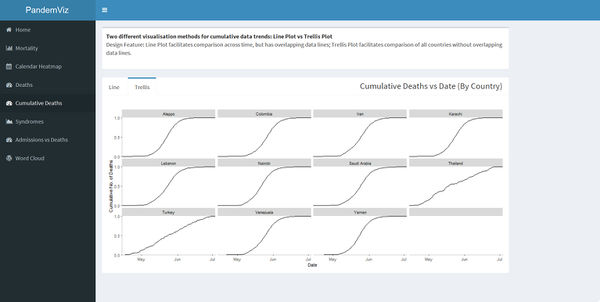
<center>[[File:G15dashboard6.jpg|600px]]</center> | <center>[[File:G15dashboard6.jpg|600px]]</center> | ||
| + | |||
| + | |||
| + | <br/> | ||
Revision as of 01:49, 7 August 2017

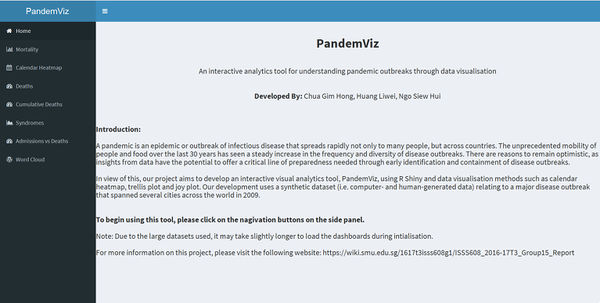
ISSS608 Visual Analytics and Applications
PandemViz: An interactive analytics tool for understanding pandemic outbreaks through data visualisation
|
|
|
|
|
Developed By: Chua Gim Hong, Huang Liwei and Ngo Siew Hui
To access the online PandemViz tool, please click on the URL below:
https://siewhui-mitb.shinyapps.io/b6pandemviz/
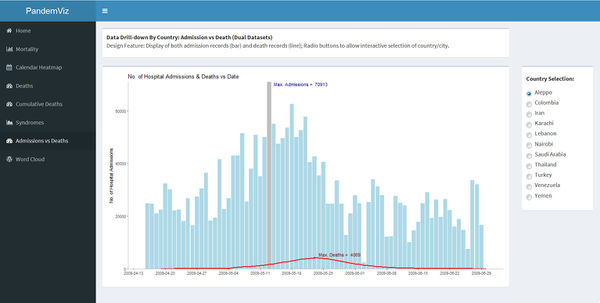
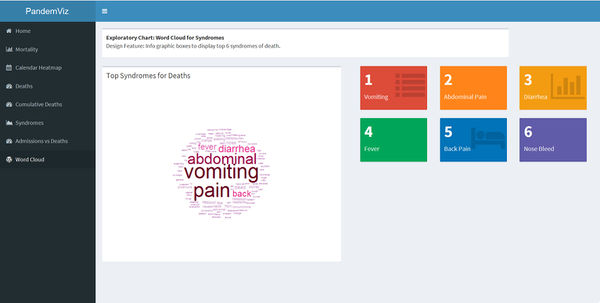
Sample Screenshots of PandemViz:


