Difference between revisions of "ISSS608 2016-17T3 Group15 Poster"
Jump to navigation
Jump to search
| Line 1: | Line 1: | ||
| − | <div style=background:# | + | <div style=background:#4682b4 border:#0099FF> |
| − | [[File: | + | [[File:Logo.jpg|245px|left]] |
<br/> | <br/> | ||
<font size = 5; color="#FFFFFF">ISSS608 Visual Analytics and Applications</font><br/> <br/> | <font size = 5; color="#FFFFFF">ISSS608 Visual Analytics and Applications</font><br/> <br/> | ||
<font size = 4; color="#FFFFFF">'''Group 15 Project'''</font><br/> | <font size = 4; color="#FFFFFF">'''Group 15 Project'''</font><br/> | ||
| − | |||
<font size = 4; color="#FFFFFF">'''PandemViz''': An interactive analytics tool for understanding pandemic outbreaks through data visualisation</font><br/> | <font size = 4; color="#FFFFFF">'''PandemViz''': An interactive analytics tool for understanding pandemic outbreaks through data visualisation</font><br/> | ||
<br/> | <br/> | ||
| Line 14: | Line 13: | ||
[[ISSS608_2016-17T3_Group15_Proposal| <font color="#FFFFFF">'''Proposal'''</font>]] | [[ISSS608_2016-17T3_Group15_Proposal| <font color="#FFFFFF">'''Proposal'''</font>]] | ||
| − | | style="font-family:Century Gothic; font-size:100%; solid #1B338F; background:# | + | | style="font-family:Century Gothic; font-size:100%; solid #1B338F; background:#54595d; text-align:center;" width="25%" | |
; | ; | ||
[[ISSS608_2016-17T3_Group15_Poster| <font color="#FFFFFF">'''Poster'''</font>]] | [[ISSS608_2016-17T3_Group15_Poster| <font color="#FFFFFF">'''Poster'''</font>]] | ||
| − | | style="font-family:Century Gothic; font-size:100%; solid #1B338F; background:# | + | | style="font-family:Century Gothic; font-size:100%; solid #1B338F; background:#6495ed; text-align:center;" width="25%" | |
; | ; | ||
[[ISSS608_2016-17T3_Group15_Application| <font color="#FFFFFF">'''Application'''</font>]] | [[ISSS608_2016-17T3_Group15_Application| <font color="#FFFFFF">'''Application'''</font>]] | ||
Revision as of 10:57, 6 August 2017
ISSS608 Visual Analytics and Applications
Group 15 Project
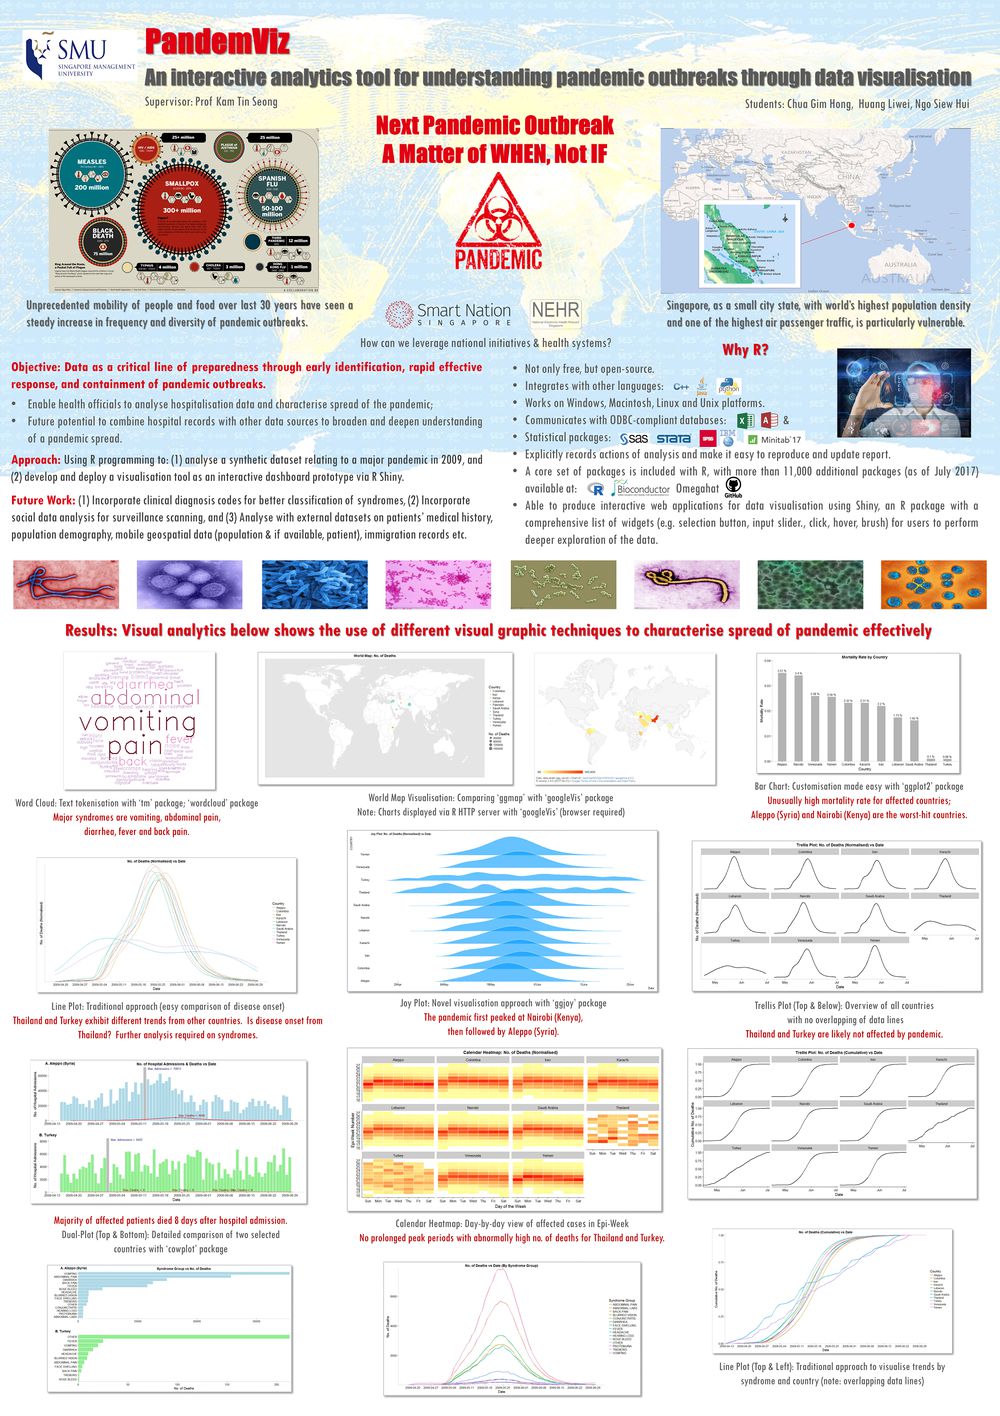
PandemViz: An interactive analytics tool for understanding pandemic outbreaks through data visualisation
|
|
|
|
|
Project Title: PandemViz - An interactive analytics tool for understanding pandemic outbreaks through data visualisation

