Difference between revisions of "Group 4"
| Line 65: | Line 65: | ||
| Year || Shows the year ranging from 2001 – 2012 | | Year || Shows the year ranging from 2001 – 2012 | ||
|- | |- | ||
| − | | Type_code || Categorizes as cause of act, means adopted, educational profile, social status and professional profile of the victim | + | | Type_code || Categorizes as cause of act, means adopted, educational profile, social status and professional profile of the victim |
|- | |- | ||
| Type || Describes the Type_code in detail | | Type || Describes the Type_code in detail | ||
Revision as of 17:21, 1 August 2017
ISSS608 Visual Analytics and Applications - Project Group 4
Exploring and Visualising Spatio-temporal Patterns of Self-inflicted Deaths in India
Abstract
India covers around 17.8% of world population, about 800,000 people commit suicide worldwide every year, and out of this 17% are Indian residents. This is a huge number especially for a developing nation like India it can hamper its growth. As the world is moving towards Smart Nations, India being one of them being enrolled into it, there is high need to educate the people on the consequences of such an act.
From our analysis, we will try to find out the patterns and various factors that lie behind such an action that becomes vital to one’s life. This will help the government officials and NGOs to identify and understand the potential victim and help the society to overcome this situation. This will help them plan different programs to run at different levels in order to enable them to fight the situation in a better way.
Using R markdown involving various packages of R, we created some good visuals which will give a clear picture to the people using it. This data visualization will not be complete if we cannot compare various factors, hence, R shiny is used to build interactive and meaningful dashboard.
About Us
We are postgraduate students at SMU, pursuing Master of IT in Business (Analytics) degree. Meet our team.
Akanksha Mittal
~ (akanksham.2016@mitb.smu.edu.sg)
Sivagamy Balamourougane
~ (sivagamyb.2016@mitb.smu.edu.sg)
Sanghavy Balamourougane
~ (sanghavyb.2016@mitb.smu.edu.sg)
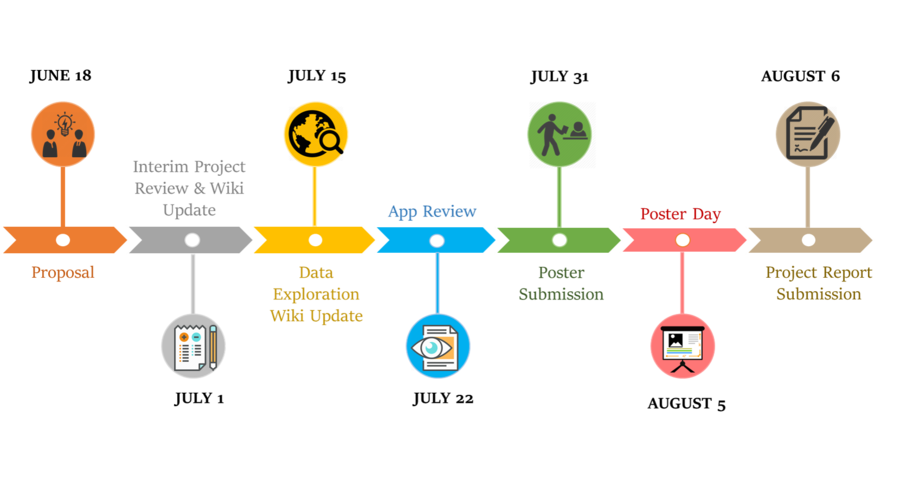
Our Project Timeline
Motivation
India, the second largest country in world population, possess stable economy, increasing literacy rate, large volume of work-force generator in almost all the fields from low level to high level job positions, exporter of many commodities, sound in technological advancements, is still struggling to enter in the developed nation's pool. Even after 70 years of independence, it still fighting with many deep routed problems like poverty, illiteracy, regional conflicts and so on. All these factors are equally responsible for degrading the growth of any nation. Out of many other factors, committing suicides is one factor which should be taken into consideration and resolved as efficiently as possible. This act not only affects the family members of the victim but also the society as a whole. This shows the emotional quotient of the society and the various pressures the countrymen are facing.
Objective
Through this project, we are trying to help the government agencies and NGOs to look into this situation seriously and identify the target areas where they can introduce educational programs and help people to overcome this situation which leads them to end their life. This will help them answer the questions such as:
- Where is this situation severe (states of India)
- What are the reasons behind this action (causes)
- What are the methods adopted (means), and
- What are the demographics of the victims (age group, education, social status, etc).
The answers to these questions will also help them understand and formulate the role of society to help them reduce suicide rates in India.
Dataset
The dataset – “Suicides in India” is downloaded from Kaggle uploaded by Rajanand Ilangovan. The dataset contains the suicides committed from 2001 – 2012. The structure of dataset is shown in the screenshot provided below:
The variables and their description:
| Variable | Description |
|---|---|
| State | Lists the 29 states and 7 union territories in India |
| Year | Shows the year ranging from 2001 – 2012 |
| Type_code | Categorizes as cause of act, means adopted, educational profile, social status and professional profile of the victim |
| Type | Describes the Type_code in detail |
| Gender | Either male or female |
| Age-group | Shows the age range of the victims |
| Total | Provides the number of victims |
