Difference between revisions of "ISSS608 2016-17 T3 Assign SANDEEP CHALLA"
| Line 72: | Line 72: | ||
<tr> | <tr> | ||
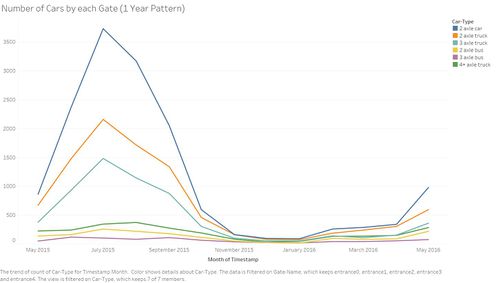
<td>[[File:Challa 1yr.jpg|500 px|left]]</td> | <td>[[File:Challa 1yr.jpg|500 px|left]]</td> | ||
| − | <td>July is the time most of the visitors come to the preserve, April to October is the time when the Preserve is relatively busy compared to other months of the year. </td> | + | <td>the frequency of vistors is not the same all the year round. Similar tres has also been observed for vehicles passing through the preserve i.e. the vehicles that are using the preserve just to enter through an entrance and leave through another entrance. July is the time most of the visitors come to the preserve, April to October is the time when the Preserve is relatively busy compared to other months of the year. </td> |
</tr> | </tr> | ||
</table> | </table> | ||
Revision as of 17:37, 14 July 2017
Contents
About the VAST Challenge
The Visual Analytics Science and Technology (VAST) Challenge is an annual contest with the goal of advancing the field of visual analytics through competition. The VAST Challenge is designed to help researchers understand how their software would be used in a novel analytic task and determine if their data transformations, visualizations, and interactions would be beneficial for particular analytic tasks. VAST Challenge problems provide researchers with realistic tasks and data sets for evaluating their software, as well as an opportunity to advance the field by solving more complex problems.
Researchers and software providers have repeatedly used the data sets from throughout the life of the VAST Challenge as benchmarks to demonstrate and test the capabilities of their systems. The ground truth embedded in the data sets has helped researchers evaluate and strengthen the utility of their visualizations.
The VAST Challenge 2017 presents three mini-challenges and a grand challenge for you to apply your visual analytics research and technologies to help a sad state of affairs in a wildlife preserve.
These challenges are open to participation by individuals and teams in industry, government, and academia. We encourage your submissions and look forward to seeing your innovative approaches to solving these challenges using visual analytics.
Overview
Mistford is a mid-size city is located to the southwest of a large nature preserve. The city has a small industrial area with four light-manufacturing endeavors. Mitch Vogel is a post-doc student studying ornithology at Mistford College and has been discovering signs that the number of nesting pairs of the Rose-Crested Blue Pipit, a popular local bird due to its attractive plumage and pleasant songs, is decreasing! The decrease is sufficiently significant that the Pangera Ornithology Conservation Society is sponsoring Mitch to undertake additional studies to identify the possible reasons. Mitch is gaining access to several datasets that may help him in his work, and he has asked you (and your colleagues) as experts in visual analytics to help him analyze these datasets.
Mini Challenge 1
The Boonsong Lekagul Nature Preserve is used by local residents and tourists for day-trips, overnight camping or sometimes just passing through to access main thoroughfares on the opposite sides of the preserve. The entrance booths of the preserve are monitored in order to generate revenue as well as monitor usage. Vehicles entering and exiting the preserve must pay a fee based on their number of axles (personal auto, recreational trailer, semi-trailer, etc.). This generates a data stream with entry/exit timestamps and vehicle type. There are also other locations in the part that register traffic passing through. While hiking through the various parts of the preserve, Mitch has noticed some odd behaviors of vehicles that he doesn’t think are consistent with the kinds of park visitors he would expect. If there were some way that Mitch could analyze the behaviors of vehicles through the park over time, this may assist him in his investigations.
Data Preparation
Question 1
“Patterns of Life” analyses depend on recognizing repeating patterns of activities by individuals or groups. Describe up to six daily patterns of life by vehicles traveling through and within the park. Characterize the patterns by describing the kinds of vehicles participating, their spatial activities (where do they go?), their temporal activities (when does the pattern happen?), and provide a hypothesis of what the pattern represents (for example, if I drove to a coffee house every morning, but did not stay for long, you might hypothesize I’m getting coffee “to-go”).
Pattern 1
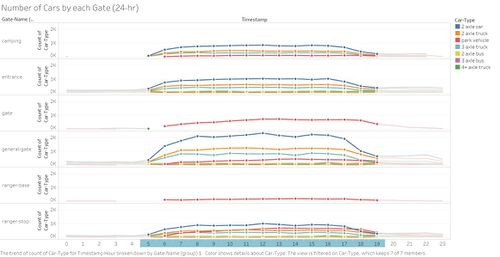
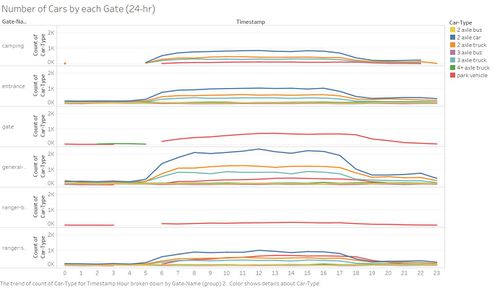
| Vehicular traffic at each gate type is plotted. It is observed that the traffic was peak between 5AM and 7PM at gate types camping, entrance, ranger stop and general gate, general gate being the highest. It can also be observed that only the park vehicles labelled 2P had access to the gates which lead to ranger base, and hence the traffic at these locations was comparatively less. General gate which was located at different locations in the preserve is well used by all vehicles. |
Pattern 2
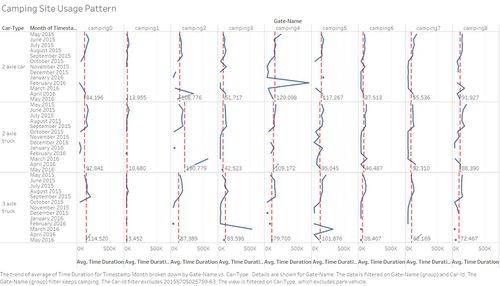
| It is observed that the vehicular movement to and from the camping areas is only in the time from 5AM to 10PM. This is probably not to disturb the animals in the preserve during the night. There is one exception which will be discussed in the corresponding section. Only car-types 2-axle-car, 2-axle-truck, 3-axle-truck are allowed in the camping areas apart from the park vehicles which has unrestricted access to all the regions of the park. |
Pattern 3
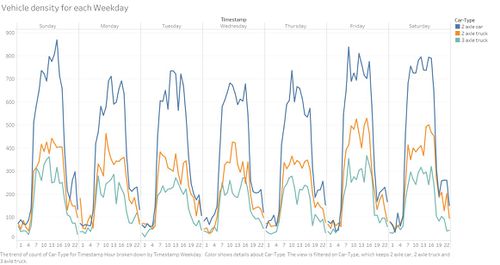
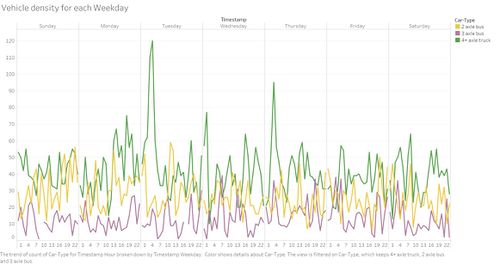
Vehicle density is plotted for different days of the week. It was observed that the vehicles which had access to camping areas had high vehicle density as compared to other vehicles. It was also observed that there were more vehicles during weekend i.e. saturday and sunday as compared to other days of the week.
Question 2
Patterns of Life analyses may also depend on understanding what patterns appear over longer periods of time (in this case, over multiple days). Describe up to six patterns of life that occur over multiple days (including across the entire data set) by vehicles traveling through and within the park. Characterize the patterns by describing the kinds of vehicles participating, their spatial activities (where do they go?), their temporal activities (when does the pattern happen?), and provide a hypothesis of what the pattern represents (for example, many vehicles showing up at the same location each Saturday at the same time may suggest some activity occurring there each Saturday).
Pattern 1
| the frequency of vistors is not the same all the year round. Similar tres has also been observed for vehicles passing through the preserve i.e. the vehicles that are using the preserve just to enter through an entrance and leave through another entrance. July is the time most of the visitors come to the preserve, April to October is the time when the Preserve is relatively busy compared to other months of the year. |
Pattern 2
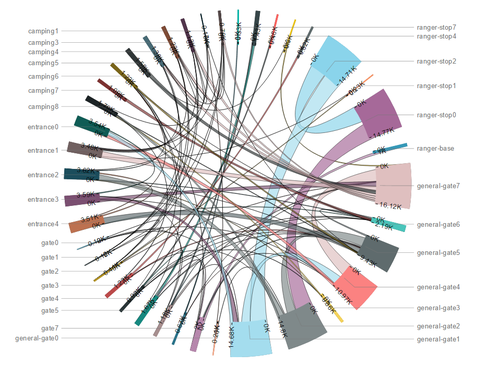
| Chord diagram shows the number of vehicles moving from one gate to another. It is seen from the chord diagram that ranger stop 1 to ranger stop 2 is the most popular route. |
Pattern 3
Question 3
Unusual patterns may be patterns of activity that changes from an established pattern, or are just difficult to explain from what you know of a situation. Describe up to six unusual patterns (either single day or multiple days) and highlight why you find them unusual.

