Difference between revisions of "ISSS608 2016-17 T3 Assign SUMALIKA KODUMURU"
| Line 21: | Line 21: | ||
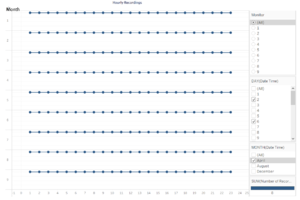
To identify the missing data, drill down to "Hour" level to note the monitors/sensors that are responsible for these readings: | To identify the missing data, drill down to "Hour" level to note the monitors/sensors that are responsible for these readings: | ||
| + | <br/> | ||
| + | [[File:Sumalika Q1P2.PNG|300px]] | ||
<br/> | <br/> | ||
Revision as of 22:57, 7 July 2017
The Curious Case of Rose-Crested Blue Pipit
Question1
Are they all working properly at all times? Can you detect any unexpected behaviors of the sensors through analyzing the readings they capture?Limit your response to no more than 9 images and 1000 words
Solution 1
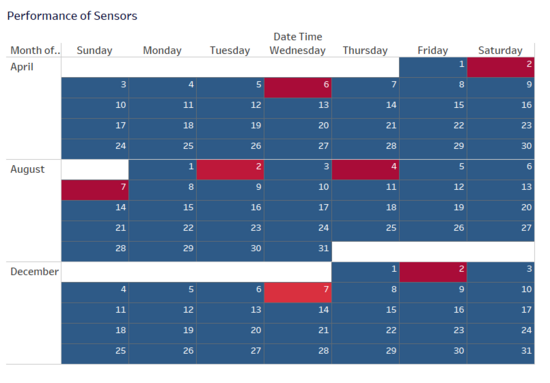
Firstly analyse the sensors performance and its operations. All the sensors need to capture the chemical readings at all times of the day for all the three months i.e. July, August and December.The "Calendar Plot" shown has dates highlighted in orange which evidently highlight the days when the sensors have failed to capture chemical readings. For example: On 2nd and 6th of April, 2nd, 4th and 7th of August and 2nd and 7th of December sensors have failed to capture the readings. Further investigation needs to be performed to make a deduction on sensor readings. At this point the sensors could have
- Incorrectly captured data
- Missed capturing data
To identify the missing data, drill down to "Hour" level to note the monitors/sensors that are responsible for these readings:


