Difference between revisions of "ISSS608 2016-17 T3 Assign ASMIT ADGAONKAR"
Jump to navigation
Jump to search
Asmita.2016 (talk | contribs) |
Asmita.2016 (talk | contribs) |
||
| Line 4: | Line 4: | ||
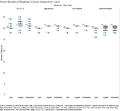
With the help of a boxplot of the hourly number of readings for each chemical each month, we can see a pattern in the aberration of sensor performance and operations. | With the help of a boxplot of the hourly number of readings for each chemical each month, we can see a pattern in the aberration of sensor performance and operations. | ||
<gallery> | <gallery> | ||
| − | Hourly-ofReadings boxplot.png | + | Hourly-ofReadings boxplot.png | 500px |
</gallery> | </gallery> | ||
Revision as of 21:41, 7 July 2017
MC2.1 – Characterize the sensors’ performance and operation. Are they all working properly at all times? Can you detect any unexpected behaviours of the sensors through analysing the readings they capture? Limit your response to no more than 9 images and 1000 words.
With the help of a boxplot of the hourly number of readings for each chemical each month, we can see a pattern in the aberration of sensor performance and operations.
