Difference between revisions of "ShinyNET Data Prep Report"
Rogers.2016 (talk | contribs) |
Rogers.2016 (talk | contribs) |
||
| Line 32: | Line 32: | ||
=Motivation of the Application= | =Motivation of the Application= | ||
| − | Airline industry in India is booming. Within the last 20 years, the industry dynamics have changed from monopoly and it is marching towards a perfect competition. 15 years before there was only one Indian airline (Air India) controlled by the government. A common person was not able to afford a flight transit. Now the affordability of a common person in India has increased. Airline is becoming a more common transit that connects different parts of the country. There are 12 domestic commercial airlines in India currently. Some do serve only certain geographic regions. | + | Airline industry in India is booming. Within the last 20 years, the industry dynamics have changed from monopoly and it is marching towards a perfect competition. 15 years before there was only one Indian airline (Air India) controlled by the government. A common person was not able to afford a flight transit. Now the affordability of a common person in India has increased. Airline is becoming a more common transit that connects different parts of the country. There are 12 domestic commercial airlines in India currently. Some do serve only certain geographic regions.<br /> |
| − | What do we infer from this? From an entrepreneurial perspective, it is not hard for an entrepreneur to start an airline business unlike 20 years before. Some of the questions that can arise for an entrepreneur aiming for an airline business are: | + | |
| − | 1. Which demographic region should I focus on? | + | What do we infer from this? From an entrepreneurial perspective, it is not hard for an entrepreneur to start an airline business unlike 20 years before.<br /> |
| − | 2. With which airlines should I partner with for increasing geographic coverage? | + | Some of the questions that can arise for an entrepreneur aiming for an airline business are:<br /> |
| − | 3. What is the air traffic over the hours in a day? | + | |
| − | 4. How can you optimize air traffic? | + | 1. Which demographic region should I focus on?<br /> |
| − | To answer all the above questions a complete visualization of the airline network including all the 12 airlines are required. Currently there are no visualization that shows the holistic knowledge of the Indian Airline network. | + | |
| + | 2. With which airlines should I partner with for increasing geographic coverage?<br /> | ||
| + | |||
| + | 3. What is the air traffic over the hours in a day?<br /> | ||
| + | |||
| + | 4. How can you optimize air traffic?<br /> | ||
| + | |||
| + | To answer all the above questions a complete visualization of the airline network including all the 12 airlines are required. Currently there are no visualization that shows the holistic knowledge of the Indian Airline network.<br /> | ||
| + | |||
Also, the visualization is a combination of geospatial and social network. Geospatial provides the location of the airports and social network provides how each and other airports are connected. Hence, the above entrepreneurial and business factors helped us to take this project and create a visualization for the same. | Also, the visualization is a combination of geospatial and social network. Geospatial provides the location of the airports and social network provides how each and other airports are connected. Hence, the above entrepreneurial and business factors helped us to take this project and create a visualization for the same. | ||
Revision as of 20:51, 6 August 2017
shinyNET:A web-based flight data visualisation toolkit using R Shiny and ggraph
|
|
|
|
|
|
Contents
Motivation of the Application
Airline industry in India is booming. Within the last 20 years, the industry dynamics have changed from monopoly and it is marching towards a perfect competition. 15 years before there was only one Indian airline (Air India) controlled by the government. A common person was not able to afford a flight transit. Now the affordability of a common person in India has increased. Airline is becoming a more common transit that connects different parts of the country. There are 12 domestic commercial airlines in India currently. Some do serve only certain geographic regions.
What do we infer from this? From an entrepreneurial perspective, it is not hard for an entrepreneur to start an airline business unlike 20 years before.
Some of the questions that can arise for an entrepreneur aiming for an airline business are:
1. Which demographic region should I focus on?
2. With which airlines should I partner with for increasing geographic coverage?
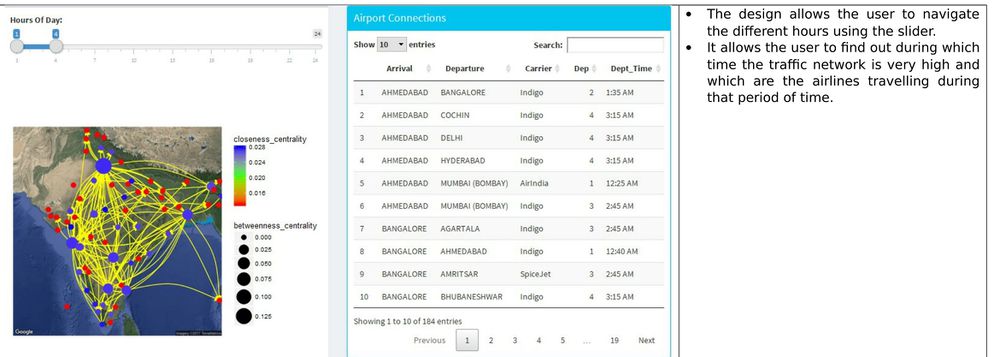
3. What is the air traffic over the hours in a day?
4. How can you optimize air traffic?
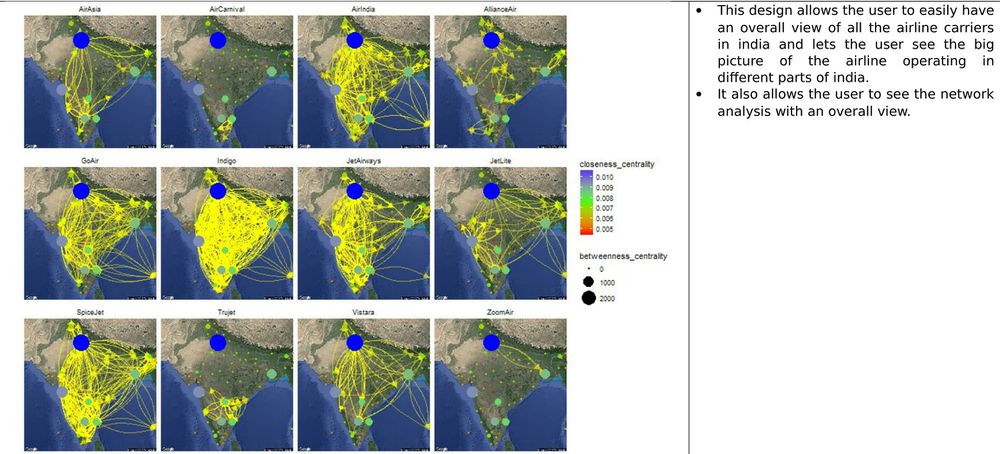
To answer all the above questions a complete visualization of the airline network including all the 12 airlines are required. Currently there are no visualization that shows the holistic knowledge of the Indian Airline network.
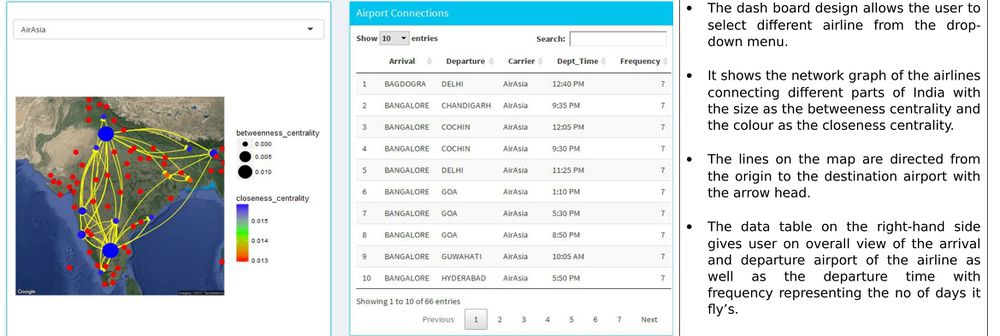
Also, the visualization is a combination of geospatial and social network. Geospatial provides the location of the airports and social network provides how each and other airports are connected. Hence, the above entrepreneurial and business factors helped us to take this project and create a visualization for the same.
Review and critic on past works
Our dashboard draws it's inspiration from the research done by "National Center for Biological Sciences, Tata Institute of Fundamental Research, Bangalore 560065, India" where they published a paper on the analysis of the airport network of India as a complex weighted network. Although research has been done in this area to analyze the airport network in India, visualization of the network is one thing that is lacking. Most of the past works has been focused on only the airport network but no focus on the airline networks. Airline network are the most important part for an airport and visualizing the traffic dynamics using Geo spatial and graph network will provide new insights for the airline industry.
We choose R-Shiny to achieve our visualization goals because of its powerful, flexible tools and packages that it offers. R with its different network and Geo spatial packages provides a rich environment for a data analyst to perform analysis, combining both network and Geo spatial data.


