Difference between revisions of "Q2"
Jump to navigation
Jump to search
| Line 31: | Line 31: | ||
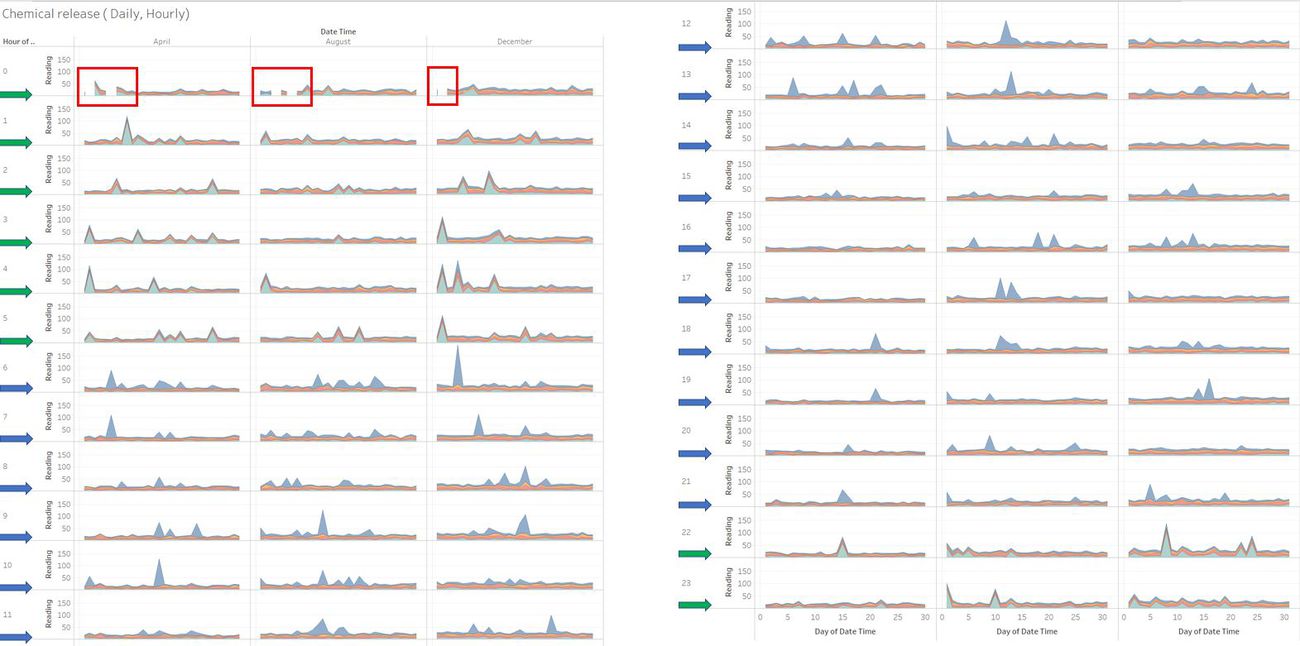
After finding excess readings captured by the monitors of AGOG-3A chemical and less of Methylosmolene, it is imperative to see if they were released in huge quantities. If yes, then we can deduce that the high release of AGOG in large number of quantity is affecting the habitat of the nature park. To analyse the release of chemicals and their readings, a stacked graph is drawn at regular hourly interval. | After finding excess readings captured by the monitors of AGOG-3A chemical and less of Methylosmolene, it is imperative to see if they were released in huge quantities. If yes, then we can deduce that the high release of AGOG in large number of quantity is affecting the habitat of the nature park. To analyse the release of chemicals and their readings, a stacked graph is drawn at regular hourly interval. | ||
<br/> | <br/> | ||
| − | [[File:Sumalika_Q2P3Final.JPG| | + | [[File:Sumalika_Q2P3Final.JPG|1300px|center|float]] |
Revision as of 19:03, 12 July 2017
 ISSS608 Visual Analytics and Applications
|
|
|
|
|
|
After finding excess readings captured by the monitors of AGOG-3A chemical and less of Methylosmolene, it is imperative to see if they were released in huge quantities. If yes, then we can deduce that the high release of AGOG in large number of quantity is affecting the habitat of the nature park. To analyse the release of chemicals and their readings, a stacked graph is drawn at regular hourly interval.
