Difference between revisions of "ISSS608 2016-17 T3 SANDEEP Question 2"
(→Answer) |
(→Answer) |
||
| Line 35: | Line 35: | ||
</tr> | </tr> | ||
</table> | </table> | ||
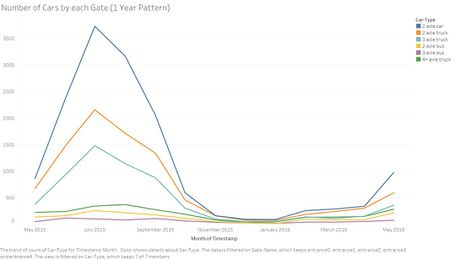
| − | + | July is the time most of the visitors come to the preserve, April to October is the time when the Preserve is relatively busy compared to other months of the year. | |
| + | |||
<table width=90%> | <table width=90%> | ||
<tr> | <tr> | ||
| − | <td>[[File: | + | <td>[[File:Chord.png|480 px|left]]</td> |
</tr> | </tr> | ||
</table> | </table> | ||
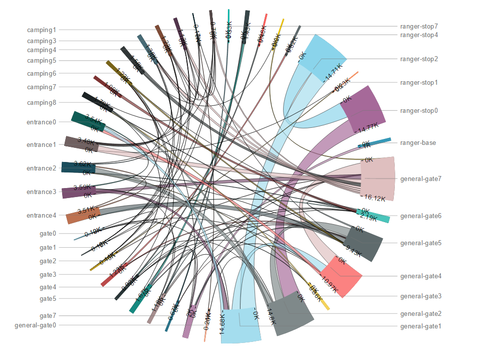
| − | + | Chord diagram shows the number of vehicles moving from one gate to another. It is seen from the chord diagram that ranger stop 1 to ranger stop 2 is the most popular route. | |
| + | |||
<table width=90%> | <table width=90%> | ||
<tr> | <tr> | ||
| − | <td>[[File: | + | <td>[[File:Challa Visitor Time Spent.jpeg|900 px|left]]</td> |
</tr> | </tr> | ||
</table> | </table> | ||
| − | |||
Latest revision as of 04:02, 8 July 2017
|
|
|
|
|
Question
Patterns of Life analyses may also depend on understanding what patterns appear over longer periods of time (in this case, over multiple days). Describe up to six patterns of life that occur over multiple days (including across the entire data set) by vehicles traveling through and within the park. Characterize the patterns by describing the kinds of vehicles participating, their spatial activities (where do they go?), their temporal activities (when does the pattern happen?), and provide a hypothesis of what the pattern represents (for example, many vehicles showing up at the same location each Saturday at the same time may suggest some activity occurring there each Saturday). Please limit your answer to six images and 500 words.
Answer
July is the time most of the visitors come to the preserve, April to October is the time when the Preserve is relatively busy compared to other months of the year.
Chord diagram shows the number of vehicles moving from one gate to another. It is seen from the chord diagram that ranger stop 1 to ranger stop 2 is the most popular route.


