Difference between revisions of "Q3"
Jump to navigation
Jump to search
(Created page with "<div style=background:#2B3856 border:#0099ff> 250px <font size = 5; color="#ffffff">ISSS608 Visual Analytics and Applications</font> </div> <br/> <!--MAIN...") |
|||
| Line 28: | Line 28: | ||
|} | |} | ||
<br/> | <br/> | ||
| − | [[File: | + | Wind Speed Trends: |
| + | <br/> | ||
| + | [[File:Sumalika_Q3P2part1.JPG|900px|right|float]] | ||
| + | <br/> | ||
| + | Wind speed analysis is done to understand the speed of the wind for each month and identify the day that experienced a lot of chemical release due to the wind speed. The charts shown describe the wind speed for each chemical released on a particular day. | ||
Revision as of 12:45, 13 July 2017
 ISSS608 Visual Analytics and Applications
|
|
|
|
|
|
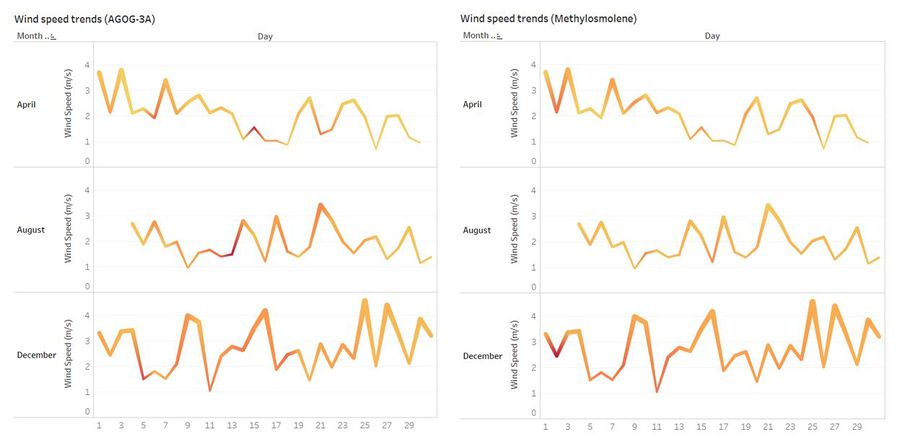
Wind Speed Trends:

Wind speed analysis is done to understand the speed of the wind for each month and identify the day that experienced a lot of chemical release due to the wind speed. The charts shown describe the wind speed for each chemical released on a particular day.