Difference between revisions of "ISSS608 2016-17 T3 Assign LIU XINTIAN Questions & Solutions"
| Line 35: | Line 35: | ||
Characterize the sensors’ performance and operation. Are they all working properly at all times? Can you detect any unexpected behaviours of the sensors through analysing the readings they capture? | Characterize the sensors’ performance and operation. Are they all working properly at all times? Can you detect any unexpected behaviours of the sensors through analysing the readings they capture? | ||
== Checking monitors working improperly == | == Checking monitors working improperly == | ||
| − | [[File:LXT_Q1_1.png|300px | + | [[File:LXT_Q1_1.png|300px|right]] |
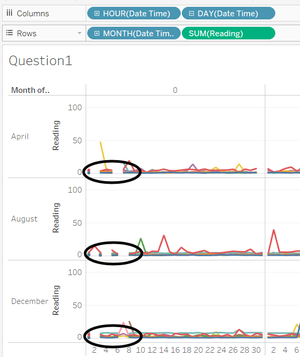
The line chart on the right shows the reading of four chemicals changed by day in the same hour in three months. Each line represents a sensor. In this way, we can find that there are some missing values at 0:00am in the beginning of these three months. This means '''all''' the sensors are not working properly at these specific times. '''The table below shows the missing value of each sensor, which means they are not working at 0:00am on these days or the sensors may be in maintenance period or some other conditions that cannot work.''' (work = “Y”, Not work = “N”) | The line chart on the right shows the reading of four chemicals changed by day in the same hour in three months. Each line represents a sensor. In this way, we can find that there are some missing values at 0:00am in the beginning of these three months. This means '''all''' the sensors are not working properly at these specific times. '''The table below shows the missing value of each sensor, which means they are not working at 0:00am on these days or the sensors may be in maintenance period or some other conditions that cannot work.''' (work = “Y”, Not work = “N”) | ||
| Line 42: | Line 42: | ||
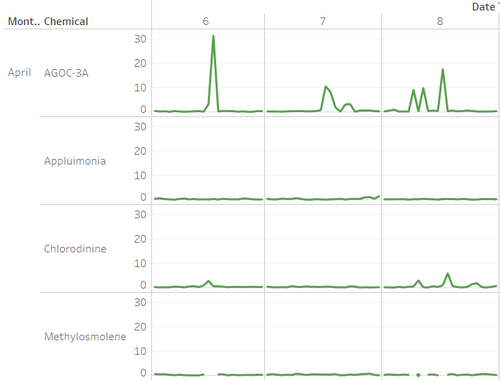
Now, let us see the readings of each chemical. All the sensors have a strange thing in detecting “Methylosmolene”. '''If “AGOC-3A” has a extremly high value, at the same time, the sensor cannot detect the reading of “Methylosmolene”.''' The graph below is an example of monitor 5, but this phenomenon appears in every sensor in the same condition. | Now, let us see the readings of each chemical. All the sensors have a strange thing in detecting “Methylosmolene”. '''If “AGOC-3A” has a extremly high value, at the same time, the sensor cannot detect the reading of “Methylosmolene”.''' The graph below is an example of monitor 5, but this phenomenon appears in every sensor in the same condition. | ||
| − | [[File:LXT_Q1_3.png|500px]] | + | [[File:LXT_Q1_3.png|500px|Q1_3]] |
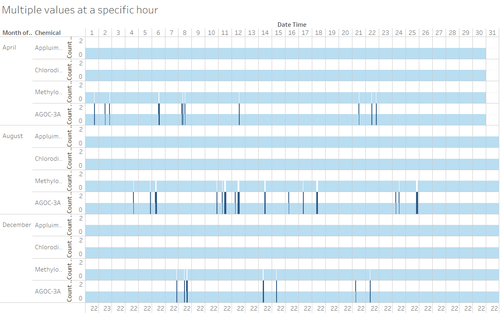
Then, we need to find out why this phenomenon happens. Why these values are extremely high? Is there any possible that at some specific hours, the monitor shows more than one reading? | Then, we need to find out why this phenomenon happens. Why these values are extremely high? Is there any possible that at some specific hours, the monitor shows more than one reading? | ||
| − | [[File:LXT_Q1_4.png|500px]] | + | [[File:LXT_Q1_4.png|500px|right|Q1_4]] |
Revision as of 22:16, 7 July 2017
|
|
|
|
|
|
|
Question 1
Characterize the sensors’ performance and operation. Are they all working properly at all times? Can you detect any unexpected behaviours of the sensors through analysing the readings they capture?
Checking monitors working improperly
The line chart on the right shows the reading of four chemicals changed by day in the same hour in three months. Each line represents a sensor. In this way, we can find that there are some missing values at 0:00am in the beginning of these three months. This means all the sensors are not working properly at these specific times. The table below shows the missing value of each sensor, which means they are not working at 0:00am on these days or the sensors may be in maintenance period or some other conditions that cannot work. (work = “Y”, Not work = “N”)
Now, let us see the readings of each chemical. All the sensors have a strange thing in detecting “Methylosmolene”. If “AGOC-3A” has a extremly high value, at the same time, the sensor cannot detect the reading of “Methylosmolene”. The graph below is an example of monitor 5, but this phenomenon appears in every sensor in the same condition.
Then, we need to find out why this phenomenon happens. Why these values are extremely high? Is there any possible that at some specific hours, the monitor shows more than one reading?


