Difference between revisions of "ISSS608 2016-17 T3 Assign SUMALIKA KODUMURU"
Jump to navigation
Jump to search
| Line 13: | Line 13: | ||
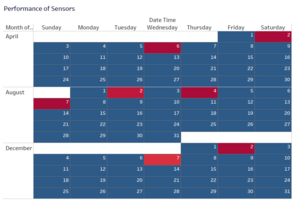
Firstly analyse the sensors performance and its operations. All the sensors need to capture the chemical readings at all times of the day for all the three months i.e. July, August and December. By plotting a "Calendar Plot" it is evidently seen that sensors are failing to record data of the chemicals released. | Firstly analyse the sensors performance and its operations. All the sensors need to capture the chemical readings at all times of the day for all the three months i.e. July, August and December. By plotting a "Calendar Plot" it is evidently seen that sensors are failing to record data of the chemicals released. | ||
The following dates represent missing or incorrectly captured readings. | The following dates represent missing or incorrectly captured readings. | ||
| − | [[File: | + | [[File:Sumalika Q1P1.PNG|thumb|Performance of Sensors]] |
{| class="wikitable" | {| class="wikitable" | ||
|- | |- | ||
Revision as of 22:02, 7 July 2017
The Curious Case of Rose-Crested Blue Pipit
Question1
Are they all working properly at all times? Can you detect any unexpected behaviors of the sensors through analyzing the readings they capture?Limit your response to no more than 9 images and 1000 words
Solution 1
Firstly analyse the sensors performance and its operations. All the sensors need to capture the chemical readings at all times of the day for all the three months i.e. July, August and December. By plotting a "Calendar Plot" it is evidently seen that sensors are failing to record data of the chemicals released. The following dates represent missing or incorrectly captured readings.
| Month | Day |
|---|---|
| April | 2 |
| April | 6 |
| August | 2 |
| August | 4 |
| August | 7 |
| December | 2 |
| December | 7 |

