Difference between revisions of "ISSS608 2016-17 T3 ROGER VISUALIZATIONS"
Jump to navigation
Jump to search
Rogers.2016 (talk | contribs) |
Rogers.2016 (talk | contribs) |
||
| Line 6: | Line 6: | ||
{|style="background-color:#fcca05 ;" width="100%" cellspacing="0" cellpadding="0" valign="top" border="0" | | {|style="background-color:#fcca05 ;" width="100%" cellspacing="0" cellpadding="0" valign="top" border="0" | | ||
| − | | style="font-family:Century Gothic; font-size:100%; solid #1B338F; background:#2b3856; text-align:center;" width=" | + | | style="font-family:Century Gothic; font-size:100%; solid #1B338F; background:#2b3856; text-align:center;" width="16%" | |
; | ; | ||
[[ISSS608 2016-17 T3 Assign ROGER GANGA SUNDARARAJ| <font color="#FFFFFF">Main Page</font>]] | [[ISSS608 2016-17 T3 Assign ROGER GANGA SUNDARARAJ| <font color="#FFFFFF">Main Page</font>]] | ||
| − | | style="font-family:Century Gothic; font-size:100%; solid #1B338F; background:#2b3856; text-align:center;" width=" | + | | style="font-family:Century Gothic; font-size:100%; solid #1B338F; background:#2b3856; text-align:center;" width="16%" | |
; | ; | ||
[[ISSS608 2016-17 T3 ROGER DATA EXPLORATION| <font color="#FFFFFF">Data Exploration</font>]] | [[ISSS608 2016-17 T3 ROGER DATA EXPLORATION| <font color="#FFFFFF">Data Exploration</font>]] | ||
| − | | style="font-family:Century Gothic; font-size:100%; solid #1B338F; background:#2b3856; text-align:center;" width=" | + | | style="font-family:Century Gothic; font-size:100%; solid #1B338F; background:#2b3856; text-align:center;" width="16%" | |
; | ; | ||
[[ISSS608 2016-17 T3 ROGER VISUALIZATIONS| <font color="#FFFFFF">Visualizations</font>]] | [[ISSS608 2016-17 T3 ROGER VISUALIZATIONS| <font color="#FFFFFF">Visualizations</font>]] | ||
| − | | style="font-family:Century Gothic; font-size:100%; solid #1B338F; background:#2b3856; text-align:center;" width=" | + | | style="font-family:Century Gothic; font-size:100%; solid #1B338F; background:#2b3856; text-align:center;" width="16%" | |
; | ; | ||
[[ISSS608 2016-17 T3 ROGER INSIGHTS| <font color="#FFFFFF">Insights</font>]] | [[ISSS608 2016-17 T3 ROGER INSIGHTS| <font color="#FFFFFF">Insights</font>]] | ||
| − | | style="font-family:Century Gothic; font-size:100%; solid #1B338F; background:#2b3856; text-align:center;" width=" | + | | style="font-family:Century Gothic; font-size:100%; solid #1B338F; background:#2b3856; text-align:center;" width="16%" | |
; | ; | ||
[[ISSS608 2016-17 T3 ROGER CONCLUSIONS| <font color="#FFFFFF">Conclusion</font>]] | [[ISSS608 2016-17 T3 ROGER CONCLUSIONS| <font color="#FFFFFF">Conclusion</font>]] | ||
| − | | style="font-family:Century Gothic; font-size:100%; solid #1B338F; background:#2b3856; text-align:center;" width=" | + | | style="font-family:Century Gothic; font-size:100%; solid #1B338F; background:#2b3856; text-align:center;" width="16%" | |
; | ; | ||
[[ISSS608 2016-17 T3 ROGER REFERENCES| <font color="#FFFFFF">References</font>]] | [[ISSS608 2016-17 T3 ROGER REFERENCES| <font color="#FFFFFF">References</font>]] | ||
| + | |||
| + | | style="font-family:Century Gothic; font-size:100%; solid #1B338F; background:#2b3856; text-align:center;" width="16%" | | ||
| + | ; | ||
| | | | ||
Revision as of 14:01, 7 July 2017
 VAST MINI CHALLENGE 1
|
|
|
|
|
|
|
|
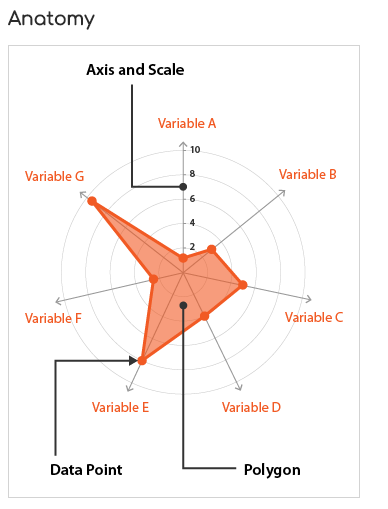
Radar Chart
For this analysis, radar plot along with the spatial visualization of the Boonsong Leakgul Preserve is provided. Radar charts, also known as Spider or Web charts, are a way of comparing multiple variables. This is useful to find which variables are similar and which variables has an outlier. In this case, the variables are the different location points where the sensors are located. The number of visits are considered as the quantitative measures of the variables. With the radar plots, similar and unusual patterns in different locations are observed.

Source: http://www.datavizcatalogue.com/methods/radar_chart.html