Difference between revisions of "ShinyNET"
| (23 intermediate revisions by the same user not shown) | |||
| Line 1: | Line 1: | ||
<div style=background:#0B5345 border:#A3BFB1> | <div style=background:#0B5345 border:#A3BFB1> | ||
| − | <font size = 5; color="#FFFFFF">shinyNET</font> | + | <font size = 5; color="#FFFFFF">shinyNET:A web-based flight data visualisation toolkit using R Shiny and ggraph(Group 14)</font> |
</div> | </div> | ||
<!--MAIN HEADER --> | <!--MAIN HEADER --> | ||
| Line 27: | Line 27: | ||
| | | | ||
|} | |} | ||
| + | |||
<!--MAIN HEADER--> | <!--MAIN HEADER--> | ||
| − | + | ==Abstract== | |
| − | + | [[File:Map1.png|framed|right]] | |
| − | |||
| − | |||
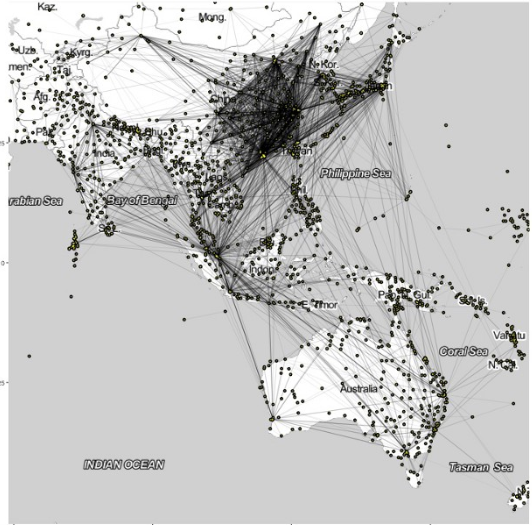
shinyNET is a web-based visual analytics tool that allows users to visualise flights data as a network graph. It is built by using R Shiny framework to integrate a collection of R packages for data wrangling, data tidying , data visualisation and graph analysis. With the responsive interfaces of shinyNET, users can choose to visualise the entire airlines systems or to visualise the network graph of a selected airlines system. It also allows users to compute network geometrics such as betweenness, closeness and to use these newly derived measures to enhance the data discovery process. | shinyNET is a web-based visual analytics tool that allows users to visualise flights data as a network graph. It is built by using R Shiny framework to integrate a collection of R packages for data wrangling, data tidying , data visualisation and graph analysis. With the responsive interfaces of shinyNET, users can choose to visualise the entire airlines systems or to visualise the network graph of a selected airlines system. It also allows users to compute network geometrics such as betweenness, closeness and to use these newly derived measures to enhance the data discovery process. | ||
| Line 38: | Line 37: | ||
All these analysis and visualisation are performed without having the users to type a single line of code. | All these analysis and visualisation are performed without having the users to type a single line of code. | ||
| − | + | ==Objective== | |
| − | |||
| − | |||
Our main aim is to investigate the airport network infrastructure of India (ANI) to explore its various properties and its traffic dynamics. We propose to build a visual network exploration tool using R. This tool can be used not only to explore the airport network in India but also can be used to explore any kind of airport network. | Our main aim is to investigate the airport network infrastructure of India (ANI) to explore its various properties and its traffic dynamics. We propose to build a visual network exploration tool using R. This tool can be used not only to explore the airport network in India but also can be used to explore any kind of airport network. | ||
| + | |||
| + | |||
| + | |||
| + | |||
| + | |||
| + | |||
| + | |||
| + | |||
| + | |||
| + | |||
| + | |||
| + | |||
| + | ==DataSet== | ||
| + | |||
| + | http://dgca.nic.in/dom_flt_schedule/flt_index.htm | ||
| + | |||
| + | |||
| + | ==Schedule== | ||
| + | <center> | ||
| + | [[File:Schedule.png|1100px]] | ||
| + | </center> | ||
Latest revision as of 11:24, 7 August 2017
shinyNET:A web-based flight data visualisation toolkit using R Shiny and ggraph(Group 14)
|
|
|
|
|
|
Contents
Abstract
shinyNET is a web-based visual analytics tool that allows users to visualise flights data as a network graph. It is built by using R Shiny framework to integrate a collection of R packages for data wrangling, data tidying , data visualisation and graph analysis. With the responsive interfaces of shinyNET, users can choose to visualise the entire airlines systems or to visualise the network graph of a selected airlines system. It also allows users to compute network geometrics such as betweenness, closeness and to use these newly derived measures to enhance the data discovery process.
All these analysis and visualisation are performed without having the users to type a single line of code.
Objective
Our main aim is to investigate the airport network infrastructure of India (ANI) to explore its various properties and its traffic dynamics. We propose to build a visual network exploration tool using R. This tool can be used not only to explore the airport network in India but also can be used to explore any kind of airport network.
DataSet
http://dgca.nic.in/dom_flt_schedule/flt_index.htm

