Difference between revisions of "Smart Mall"
| (3 intermediate revisions by 3 users not shown) | |||
| Line 4: | Line 4: | ||
</div> | </div> | ||
<div style="width: 100%; display: table;"> | <div style="width: 100%; display: table;"> | ||
| − | <div style="width: 600px; display: table-cell;"> | + | <div style="width: 600px; display: table-cell; background: #ffffff;"><font size=5; color="#000000"><span style="font-family:Calibri;">Milestone</span></font></div> |
| − | <div style="width: 400px; display: table-cell;"> [[File:T3 banner.png|right| | + | <div style="width: 400px; display: table-cell;"> [[File:T3 banner.png|right|1000x400 px]] </div> |
</div> | </div> | ||
| − | |||
| − | |||
| − | ==' | + | <div style="text-align:left; padding-top:25px; font-family:Calibri;"> |
| − | < | + | <font size = 5>Motivation</font> |
| + | <br>Brick and Mortar retail malls are facing stiff challenge from online e-commerce shopping and mobile smartphone penetration. How can physical malls continue to survive under such conditions? How can shopping malls transform as part of the Smart Nation in Singapore? Using real data of a mega-mall, this project aims to leverage multiple data sources from typical retail operation, and develop a visual application to assist company reveal customer behavior, uncover patterns that may present opportunities for the mall as well as tenants to better optimise operations, layout, events, maximize sales as well improve the customers' experience. | ||
| + | </div> | ||
| + | |||
| + | <div style="text-align:left; padding-top:25px; font-family:Calibri;"> | ||
| + | <font size = 5>Data Description</font> | ||
[[File:T3 Datades.PNG|center|800x300 px]] | [[File:T3 Datades.PNG|center|800x300 px]] | ||
| − | |||
| − | |||
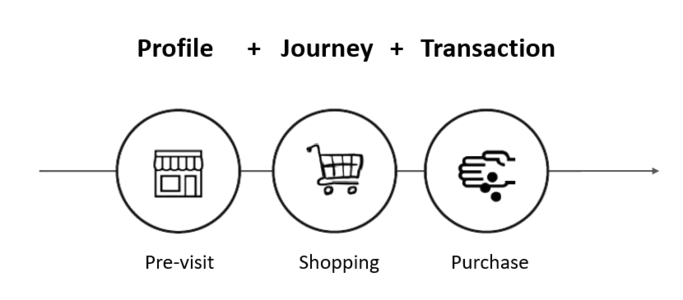
<li>Profile Data: contains demographic information of the shopping mall members</li> | <li>Profile Data: contains demographic information of the shopping mall members</li> | ||
<li>Transaction Data: contains two months transnational records from January to February 2017</li> | <li>Transaction Data: contains two months transnational records from January to February 2017</li> | ||
| − | <li>Wi-Fi Sensor Data: contains two months Wi-Fi sensor records captured in the mall, which can be used to analyze the movement of customers</li> | + | <li>Wi-Fi Sensor Movement Data: contains two months Wi-Fi sensor records captured in the mall, which can be used to analyze the movement of customers</li> |
<li>Maps: shopping mall layouts</li> | <li>Maps: shopping mall layouts</li> | ||
</div> | </div> | ||
| − | == | + | |
| − | < | + | <div style="text-align:left; padding-top:25px; font-family:Calibri;"> |
| + | <font size = 5>Expected Outcome</font> | ||
<li>Data Integration: bridge the three dataset to drive insights</li> | <li>Data Integration: bridge the three dataset to drive insights</li> | ||
<li></li> | <li></li> | ||
<li></li> | <li></li> | ||
<li></li> | <li></li> | ||
| − | </ | + | </div> |
| − | == | + | <div style="text-align:left; padding-top:25px; font-family:Calibri;"> |
| − | < | + | <font size = 5>Visualization Tool & Packages</font> |
<li>R: Hexagonal binning using ggplot2 and Kernel Decimal Estimate using stat_Density2d</li> | <li>R: Hexagonal binning using ggplot2 and Kernel Decimal Estimate using stat_Density2d</li> | ||
<li>R: Chord diagram using chorddiag</li> | <li>R: Chord diagram using chorddiag</li> | ||
<li>R: Shinyapp, shinydashboard, flexdashboard</li> | <li>R: Shinyapp, shinydashboard, flexdashboard</li> | ||
| − | </ | + | </div> |
Latest revision as of 12:20, 17 June 2017
ISSS608 Visual Analytics and Applications Project
Team S-MALL
Motivation
Brick and Mortar retail malls are facing stiff challenge from online e-commerce shopping and mobile smartphone penetration. How can physical malls continue to survive under such conditions? How can shopping malls transform as part of the Smart Nation in Singapore? Using real data of a mega-mall, this project aims to leverage multiple data sources from typical retail operation, and develop a visual application to assist company reveal customer behavior, uncover patterns that may present opportunities for the mall as well as tenants to better optimise operations, layout, events, maximize sales as well improve the customers' experience.
Data Description
Expected Outcome
Visualization Tool & Packages

