Difference between revisions of "ISSS608 2016-17 T3 Assign SANDHYA VASUDEVA RAO"
| (28 intermediate revisions by the same user not shown) | |||
| Line 4: | Line 4: | ||
</div> | </div> | ||
| − | {|style="background-color:# | + | {|style="background-color:#800000;" width="100%" cellspacing="0" cellpadding="0" valign="top" border="0" | |
| − | | style="font-size:100%; solid #000000; background:# | + | | style="font-size:100%; solid #000000; background:#800000; text-align:center;" width="25%" | |
| − | + | <font color="#FFFFFF">Overview & Data Preparation</font> | |
| − | | style="font-size:100%; solid #1B338F; background:# | + | | style="font-size:100%; solid #1B338F; background:#800000; text-align:center;" width="25%" | |
| − | [[ | + | [[Analysis 1| <font color="#FFFFFF">Q1</font>]] |
| − | | style="font-size:100%; solid #1B338F; background:# | + | | style="font-size:100%; solid #1B338F; background:#800000; text-align:center;" width="25%" | |
| − | [[ | + | [[Analysis 2| <font color="#FFFFFF">Q2</font>]] |
| − | | style="font-size:100%; solid #1B338F; background:# | + | | style="font-size:100%; solid #1B338F; background:#800000; text-align:center;" width="25%" | |
| − | [[ | + | [[Analysis 3| <font color="#FFFFFF">Q3 & Top 3</font>]] |
|} | |} | ||
<br/> | <br/> | ||
| + | <div> | ||
| + | <font size = 4; color="Black"><b>''Background''</b></font> | ||
| + | </div> | ||
| + | Boonsong Lekagul Nature Preserve is currently seeing a decline in the nesting of Rose-crested Blue Pipit, which may be attributed to the traffic going through the preserve or perhaps related to the campers in the birds' habitat. A few patterns have been analyzed using the traffic data collected by the park rangers as a part of their annual report to the local government. The map of the Nature Preserve is as shown below. | ||
| + | |||
| + | [[File:Lekagul_Roadways_labeled_v2.jpg || 400 px]] | ||
| + | Visualizations done with Tableau were used to solve the questions that are a part of the challenge. A repeating pattern recognition to describe the daily patterns of life by vehicles traveling through and within the park with descriptions about the vehicles and their spatial activities was one such question. Patterns of life over a long period of time were also analysed, which included the temporal activities of vehicles passing through and within the park over multiple days. In addition to this, unusual patterns were also studied and analysed in detail. Finally, a decision on the top 3 patterns that were primarily suspect to causing such an impact to bird life were listed down. | ||
<div> | <div> | ||
| − | <font size = 4; color="Black"><b>'' | + | <font size = 4; color="Black"><b>''Data Prep''</b></font> |
</div> | </div> | ||
| + | <div> | ||
| + | == Tools Used== | ||
| + | * JMP for Data cleaning, and transformation. | ||
| + | * Tableau for visualization | ||
| + | * Microsoft Excel for Data cleaning, and transformation. | ||
| − | + | == Data prep to plot the coordinates on the Map == | |
| + | Create 2 columns on the dataset provided - X and Y. It is given that the grid size is 200*200. Therefore, X and Y will have a combination of 1 to 200 as values. | ||
| + | The next step is to identify X and Y coordinates for gates on the map. The below picture shows the coordinates for each gate-name. | ||
| − | + | [[File:DataPrep.png || 200 px]] | |
| − | |||
| − | |||
| − | + | Load the file with these coordinates mapped in the data file into Tableau. | |
| − | + | Choose X and Y coordinates as Rows and Columns respectively. | |
| − | + | [[File: BeforeBackground.png || 600 px]] | |
| − | [[File: | ||
| − | + | Insert background image as the map of the Nature Preserve as shown above by setting the parameters as 0 to 200. | |
| − | + | ||
| − | + | [[File: AfterBackground.png || 400 px]] | |
| − | + | ||
| + | == Data prep to Categorize visitors as Single Day and Multiple Days == | ||
| + | The entire data was divided into visitors that visited the Nature Preserve just for a day and those that visited over multiple days. | ||
| + | Based on the Timestamp, all the visitors whose start date and end date were the same were categorized as Single day visitors. The rest as Multiple day visitors. | ||
| + | |||
| + | Timestamp is sorted and the following formula is applied to see if the start and end date of a Car Id is the same. If yes, then those IDs are Single Day Visitors and the rest of the IDs are Multiple Day Visitors. | ||
| − | + | [[File: DataPrep1.png || 400 px ]] | |
| − | + | Once the Car Ids are identified with 1 - Single day, Else - Multiple day, all the records of the respective IDs are separated for further analysis. | |
| − | + | Some of the Single Day Car IDs are as follows. There are about 98976 Single day visits. | |
| − | |||
| − | 1 | ||
| − | |||
| − | |||
| − | + | [[File: SampleSingle.png || 200 px ]] | |
| − | + | Some of the Multiple Day Car IDs are as follows. There are about 72503 Multiple day visits. | |
| − | |||
| − | [[ | + | [[File: SampleMultiple.png || 200 px ]] |
| − | |||
| − | |||
Latest revision as of 20:37, 17 July 2017
|
Overview & Data Preparation |
Background
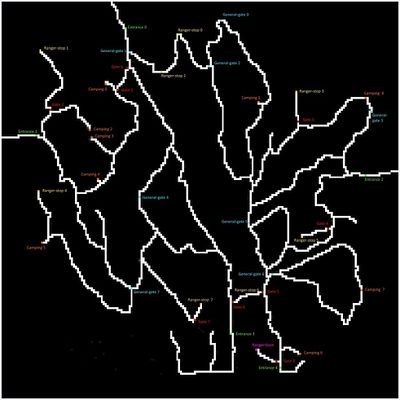
Boonsong Lekagul Nature Preserve is currently seeing a decline in the nesting of Rose-crested Blue Pipit, which may be attributed to the traffic going through the preserve or perhaps related to the campers in the birds' habitat. A few patterns have been analyzed using the traffic data collected by the park rangers as a part of their annual report to the local government. The map of the Nature Preserve is as shown below.
Visualizations done with Tableau were used to solve the questions that are a part of the challenge. A repeating pattern recognition to describe the daily patterns of life by vehicles traveling through and within the park with descriptions about the vehicles and their spatial activities was one such question. Patterns of life over a long period of time were also analysed, which included the temporal activities of vehicles passing through and within the park over multiple days. In addition to this, unusual patterns were also studied and analysed in detail. Finally, a decision on the top 3 patterns that were primarily suspect to causing such an impact to bird life were listed down.
Data Prep
Tools Used
- JMP for Data cleaning, and transformation.
- Tableau for visualization
- Microsoft Excel for Data cleaning, and transformation.
Data prep to plot the coordinates on the Map
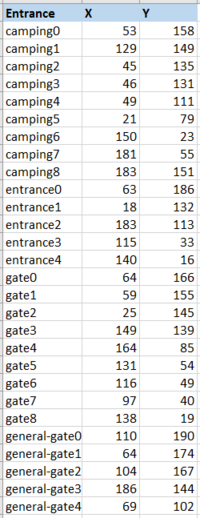
Create 2 columns on the dataset provided - X and Y. It is given that the grid size is 200*200. Therefore, X and Y will have a combination of 1 to 200 as values. The next step is to identify X and Y coordinates for gates on the map. The below picture shows the coordinates for each gate-name.
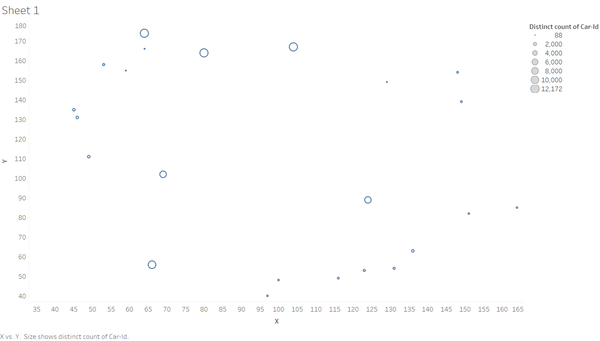
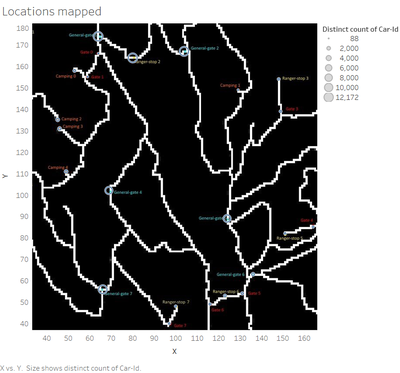
Load the file with these coordinates mapped in the data file into Tableau. Choose X and Y coordinates as Rows and Columns respectively.
Insert background image as the map of the Nature Preserve as shown above by setting the parameters as 0 to 200.
Data prep to Categorize visitors as Single Day and Multiple Days
The entire data was divided into visitors that visited the Nature Preserve just for a day and those that visited over multiple days. Based on the Timestamp, all the visitors whose start date and end date were the same were categorized as Single day visitors. The rest as Multiple day visitors.
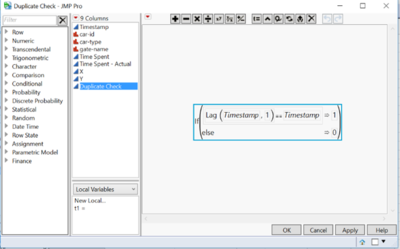
Timestamp is sorted and the following formula is applied to see if the start and end date of a Car Id is the same. If yes, then those IDs are Single Day Visitors and the rest of the IDs are Multiple Day Visitors.
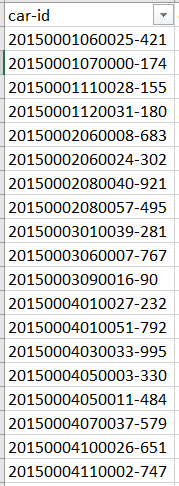
Once the Car Ids are identified with 1 - Single day, Else - Multiple day, all the records of the respective IDs are separated for further analysis. Some of the Single Day Car IDs are as follows. There are about 98976 Single day visits.
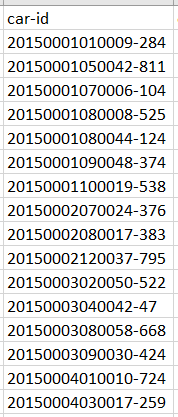
Some of the Multiple Day Car IDs are as follows. There are about 72503 Multiple day visits.
