Difference between revisions of "ISSS608 2016-17 T3 Assign DEBASISH BEHERA Visualizations"
| (13 intermediate revisions by the same user not shown) | |||
| Line 1: | Line 1: | ||
| − | <div style=background:# | + | <div style=background:#0B5345 border:#A3BFB1> |
| − | [[Image: | + | [[Image:Vacomm_logo.jpg|300px]] |
| − | <font size = 5; color="#FFFFFF">VAST Challenge: Mini Challenge 2</font> | + | <font size = 5; color="#FFFFFF">VAST Challenge: Mini Challenge 2</font> |
</div> | </div> | ||
<!--MAIN HEADER --> | <!--MAIN HEADER --> | ||
{|style="background-color:#0B5345;" width="100%" cellspacing="0" cellpadding="0" valign="top" border="0" | | {|style="background-color:#0B5345;" width="100%" cellspacing="0" cellpadding="0" valign="top" border="0" | | ||
| − | | style="font-family:Century Gothic; font-size:100%; solid #1B338F; background:# | + | | style="font-family:Century Gothic; font-size:100%; solid #1B338F; background:#0B5345; text-align:center;" width="25%" | |
; | ; | ||
[[ISSS608_2016-17_T3_Assign_DEBASISH BEHERA_Overview| <font color="#FFFFFF">Introduction</font>]] | [[ISSS608_2016-17_T3_Assign_DEBASISH BEHERA_Overview| <font color="#FFFFFF">Introduction</font>]] | ||
| Line 19: | Line 19: | ||
| style="font-family:Century Gothic; font-size:100%; solid #1B338F; background:#0B5345; text-align:center;" width="25%" | | | style="font-family:Century Gothic; font-size:100%; solid #1B338F; background:#0B5345; text-align:center;" width="25%" | | ||
; | ; | ||
| − | [[ISSS608_2016-17_T3_Assign_DEBASISH BEHERA_Feedback| <font color="#FFFFFF"> | + | [[ISSS608_2016-17_T3_Assign_DEBASISH BEHERA_Feedback| <font color="#FFFFFF">Submission and Comments</font>]] |
| | | | ||
| Line 26: | Line 26: | ||
<!--MAIN HEADER--> | <!--MAIN HEADER--> | ||
| − | ==Question 1 | + | <div style=background:#0B5345 border:#A3BFB1> |
| + | <font size = 3; color="#FFFFFF">Question 1</font> | ||
| + | </div> | ||
| + | |||
Characterize the sensors’ performance and operation. Are they all working properly at all times? Can you detect any unexpected behaviors of the sensors through analyzing the readings they capture? | Characterize the sensors’ performance and operation. Are they all working properly at all times? Can you detect any unexpected behaviors of the sensors through analyzing the readings they capture? | ||
| Line 32: | Line 35: | ||
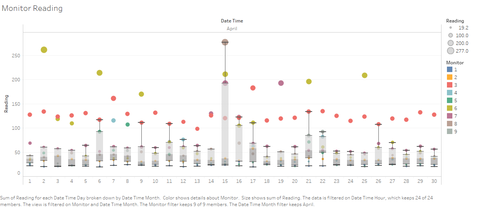
Month: April | Month: April | ||
| − | [[File:BoxPlot_1.png| | + | [[File:BoxPlot_1.png|500px]] |
| − | <div style="float:center;text-align:left;font-size:12px;"> <u>''Figure 1''</u> </div> | + | <div style="float:center;text-align:left;font-size:12px;"> <u>''Figure 1 April''</u> </div> |
Using of box-plot shows some of the outlier readings which are consistently very high. | Using of box-plot shows some of the outlier readings which are consistently very high. | ||
| Line 42: | Line 45: | ||
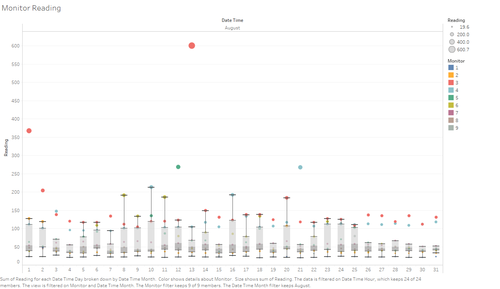
Month: August | Month: August | ||
| − | [[File:BoxPlot_2.png| | + | [[File:BoxPlot_2.png|500px]] |
| − | <div style="float:center;text-align:left;font-size:12px;"> <u>''Figure 2''</u> </div> | + | <div style="float:center;text-align:left;font-size:12px;"> <u>''Figure 2 August''</u> </div> |
We notice that the readings are very high for the monitor 3,4 and 6. | We notice that the readings are very high for the monitor 3,4 and 6. | ||
| Line 51: | Line 54: | ||
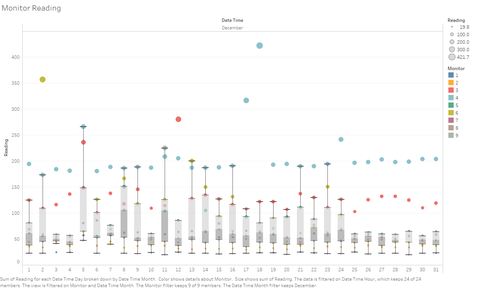
Month: December | Month: December | ||
| − | [[File:BoxPlot_3.png| | + | [[File:BoxPlot_3.png|500px]] |
| − | <div style="float:center;text-align:left;font-size:12px;"> <u>''Figure 3''</u> </div> | + | <div style="float:center;text-align:left;font-size:12px;"> <u>''Figure 3 December''</u> </div> |
* We notice that very high readings are showing for monitor 3,4 and 6. | * We notice that very high readings are showing for monitor 3,4 and 6. | ||
| Line 59: | Line 62: | ||
| − | [[File:Line 1.png| | + | [[File:Line 1.png|500px]] |
<div style="float:center;text-align:left;font-size:12px;"> <u>''Figure 4''</u> </div> | <div style="float:center;text-align:left;font-size:12px;"> <u>''Figure 4''</u> </div> | ||
| Line 72: | Line 75: | ||
Ideally the no of readings that are captured by each of the sensors should be equal! | Ideally the no of readings that are captured by each of the sensors should be equal! | ||
| − | [[File:Heat_April.png| | + | [[File:Heat_April.png|500px]] |
| − | <div style="float:center;text-align:left;font-size:12px;"> <u>''Figure 5''</u> </div> | + | <div style="float:center;text-align:left;font-size:12px;"> <u>''Figure 5 April''</u> </div> |
| − | [[File:Heat_August.png| | + | [[File:Heat_August.png|500px]] |
| − | <div style="float:center;text-align:left;font-size:12px;"> <u>''Figure 6''</u> </div> | + | <div style="float:center;text-align:left;font-size:12px;"> <u>''Figure 6 August''</u> </div> |
| − | [[File:Heat_December.png| | + | [[File:Heat_December.png|500px]] |
| − | <div style="float:center;text-align:left;font-size:12px;"> <u>''Figure 7''</u> </div> | + | <div style="float:center;text-align:left;font-size:12px;"> <u>''Figure 7 December''</u> </div> |
From the readings obtained for the month of April, August and December it seems that whenever there is an increase in readings of chemical AGOC-3A there is a decrease in the readings of the chemical Methylosmolene. | From the readings obtained for the month of April, August and December it seems that whenever there is an increase in readings of chemical AGOC-3A there is a decrease in the readings of the chemical Methylosmolene. | ||
| Line 91: | Line 94: | ||
* For the sensors 3,4,5,6,9 the no of readings recorded seems to change a lot especially for the month of August whereas the no of readings from sensor 1 and 2 varies very little throughout the 3 months time. | * For the sensors 3,4,5,6,9 the no of readings recorded seems to change a lot especially for the month of August whereas the no of readings from sensor 1 and 2 varies very little throughout the 3 months time. | ||
| − | ==Question 2 | + | <div style=background:#0B5345 border:#A3BFB1> |
| + | <font size = 3; color="#FFFFFF">Question 2</font> | ||
| + | </div> | ||
| + | |||
Which chemicals are being detected by the sensor group? What patterns of chemical releases do you see, as being reported in the data? | Which chemicals are being detected by the sensor group? What patterns of chemical releases do you see, as being reported in the data? | ||
| Line 101: | Line 107: | ||
Now let us see the readings of the chemicals throughout the different monitor readings. | Now let us see the readings of the chemicals throughout the different monitor readings. | ||
| − | [[File:CalenderPlot.png| | + | [[File:CalenderPlot.png|500px]] |
| + | <div style="float:center;text-align:left;font-size:12px;"> <u>''Figure 1''</u> </div> | ||
| − | April: | + | April Readings: |
| − | AGOC-3A- monitor/sensor 4,5,6,8,9 are the group of monitors that are showing very high spikes in terms of readings mainly between 05:00 AM to 02:00 PM. Sensors 1 and 2 captures most of the readings throughout the day. | + | * AGOC-3A- monitor/sensor 4,5,6,8,9 are the group of monitors that are showing very high spikes in terms of readings mainly between 05:00 AM to 02:00 PM. Sensors 1 and 2 captures most of the readings throughout the day. |
| − | Appluimonia- Monitor/sensor 6,7 and 9 are the groups of sensors that are showing very high spikes in readings. | + | * Appluimonia- Monitor/sensor 6,7 and 9 are the groups of sensors that are showing very high spikes in readings. |
| − | Chlorodinine-1,4,5,6,8 are the sensors group that captures most of the reading during 12:00 AM to 03:00 AM. Sensors 1,2,8 are able to capture the readings throughout the day. | + | * Chlorodinine-1,4,5,6,8 are the sensors group that captures most of the reading during 12:00 AM to 03:00 AM. Sensors 1,2,8 are able to capture the readings throughout the day. |
| − | Methylosmolene-1,2,3,8 are the sensors that capture most of the readings throughout the day with sensors 4,6,7,8 showing high spikes only in the morning hours. | + | * Methylosmolene-1,2,3,8 are the sensors that capture most of the readings throughout the day with sensors 4,6,7,8 showing high spikes only in the morning hours. |
Here we have to see whether this pattern exists throughout rest of the months as well. | Here we have to see whether this pattern exists throughout rest of the months as well. | ||
| − | [[File:April_Horizon.png| | + | [[File:April_Horizon.png|500px]] |
| + | <div style="float:center;text-align:left;font-size:12px;"> <u>''Figure 2 April''</u> </div> | ||
| + | |||
| + | |||
| + | August Readings: | ||
| − | + | * AGOC-3A- sensors 3,4,5,6 captured very high readings for this chemical between 5:00 AM to 4:00 PM | |
| + | * Appluimonia -2,3 and 9 are the sensors that captured this chemical reading. | ||
| + | * Chlorodinine-sensors 3,4,8 and 9 captured most of the readings of this chemical | ||
| + | * Methylosmolene-1,8,9 are the sensors that captured most of the readings here. | ||
| − | |||
| − | |||
| − | |||
| − | |||
Whereas some spikes were observed by the sensors 2,5 and 6 during the time 12:00 AM to 6:00 AM | Whereas some spikes were observed by the sensors 2,5 and 6 during the time 12:00 AM to 6:00 AM | ||
| − | [[File:August_Horizon.png| | + | [[File:August_Horizon.png|500px]] |
| + | <div style="float:center;text-align:left;font-size:12px;"> <u>''Figure 3 August''</u> </div> | ||
| + | |||
| − | December: | + | December Readings: |
| − | AGOC-3A- Here the sensors 1,2,3 shows spikes in the readings at 6:00 AM where as the sensors 4,5,6 are picking up very high spike in the readings. | + | * AGOC-3A- Here the sensors 1,2,3 shows spikes in the readings at 6:00 AM where as the sensors 4,5,6 are picking up very high spike in the readings. |
| − | Appluimonia – sensor 6 and 7 show high readings . | + | * Appluimonia – sensor 6 and 7 show high readings . |
| − | Chlorodinine- sensor 5 and 6 here are showing some high readings. | + | * Chlorodinine- sensor 5 and 6 here are showing some high readings. |
| − | Methylosmolene-1,3,5,6,8,9 observed very high spikes in the readings during the night hours which seems to suggest that this chemical which is banned and most dangerous of all the chemicals are being released by the factory during the night hours. In our case, we observe the spike in the readings from 10:00 PM to 6:00 AM | + | * Methylosmolene-1,3,5,6,8,9 observed very high spikes in the readings during the night hours which seems to suggest that this chemical which is banned and most dangerous of all the chemicals are being released by the factory during the night hours. In our case, we observe the spike in the readings from 10:00 PM to 6:00 AM |
This trend is similar to the high spikes that was observed in the month of April. | This trend is similar to the high spikes that was observed in the month of April. | ||
Also, it seems that this particular chemical shows spike in the morning hours but no spike between 6:00 AM to 10:00 PM which may suggest that the factories may have been neutralizing the chemical after 6:00 AM but at night they may not be doing so. | Also, it seems that this particular chemical shows spike in the morning hours but no spike between 6:00 AM to 10:00 PM which may suggest that the factories may have been neutralizing the chemical after 6:00 AM but at night they may not be doing so. | ||
| − | [[File:December_Horizon.png| | + | [[File:December_Horizon.png|500px]] |
| + | <div style="float:center;text-align:left;font-size:12px;"> <u>''Figure 4 December''</u> </div> | ||
| + | |||
| + | <div style=background:#0B5345 border:#A3BFB1> | ||
| + | <font size = 3; color="#FFFFFF">Question 3</font> | ||
| + | </div> | ||
| − | |||
Which factories are responsible for which chemical releases? Carefully describe how you determined this using all the data you have available. For the factories you identified, describe any observed patterns of operation revealed in the data. | Which factories are responsible for which chemical releases? Carefully describe how you determined this using all the data you have available. For the factories you identified, describe any observed patterns of operation revealed in the data. | ||
| − | + | [[File:Agoc Kaisos.png|500px]] | |
| + | <div style="float:center;text-align:left;font-size:12px;"> <u>''Figure 1''</u> </div> | ||
| + | |||
| + | * The Chemical Agoc-3A was emitted by Kaiso and Road Runner- Time 6/4/201-6:00 AM | ||
| + | |||
| − | + | [[File:Agoc Kaisos roadrunner.png|500px]] | |
| + | <div style="float:center;text-align:left;font-size:12px;"> <u>''Figure 2''</u> </div> | ||
| − | + | * The Chemical Agoc-3A was emitted by Kaiso and Roadrunner-12/8/2016-9:00 AM | |
| − | |||
| − | + | [[File:Agoc Kaisos roadrunner2.png|500px]] | |
| + | <div style="float:center;text-align:left;font-size:12px;"> <u>''Figure 3''</u> </div> | ||
| − | + | * The Chemical Agoc-3A was emitted by Kaiso and Roadrunner-12/8/2016-12:00 PM | |
| − | |||
| − | + | [[File:App Rad.png|500px]] | |
| + | <div style="float:center;text-align:left;font-size:12px;"> <u>''Figure 4''</u> </div> | ||
| − | + | * Applumonia was emitted by the factory Radiance-15/4/2016-9:00 PM | |
| − | |||
| − | + | [[File:App Rad indigo.png|500px]] | |
| + | <div style="float:center;text-align:left;font-size:12px;"> <u>''Figure 5''</u> </div> | ||
| − | [[File: | + | * Applumonia was emitted by the factory Radiance and indigo-16/4/2016-12:00 PM |
| + | |||
| + | |||
| + | [[File:App Radiance.png|500px]] | ||
| + | <div style="float:center;text-align:left;font-size:12px;"> <u>''Figure 6''</u> </div> | ||
| + | |||
| + | * Applumonia was emitted by the factory Radiance-29/4/2016-9:00 AM | ||
| + | |||
| + | |||
| + | [[File:Chloro Road.png|500px]] | ||
| + | <div style="float:center;text-align:left;font-size:12px;"> <u>''Figure 7''</u> </div> | ||
| − | + | * Chlorodinine was emitted by factory RoadRunner-4/4/2016-12:00 PM | |
| − | |||
| − | [[File: | + | [[File:Chloro Road1.png|500px]] |
| + | <div style="float:center;text-align:left;font-size:12px;"> <u>''Figure 8''</u> </div> | ||
| − | + | * Chlorodinine was emitted by factory RoadRunner-9/4/2016-5:00 PM | |
| − | |||
| − | + | [[File:Chloro Road2.png|500px]] | |
| + | <div style="float:center;text-align:left;font-size:12px;"> <u>''Figure 9''</u> </div> | ||
| − | + | * Chlorodinine was emitted by factory RoadRunner and Kaiso-12/4/2016-6:00 AM | |
| − | |||
| − | [[File: | + | [[File:Methyl indigo.png|500px]] |
| + | <div style="float:center;text-align:left;font-size:12px;"> <u>''Figure 10''</u> </div> | ||
| − | + | * Methylosomolene was emitted by the factory Indigo-18/8/2016-6:00 AM | |
| − | |||
| − | + | [[File:Methyl kaiso.png|500px]] | |
| + | <div style="float:center;text-align:left;font-size:12px;"> <u>''Figure 11''</u> </div> | ||
| − | + | * Methylosomolene was emitted by the factory Kaiso-2/4/2016-3:00 AM | |
| − | |||
| − | [[File: | + | [[File:Methyl rad.png|500px]] |
| + | <div style="float:center;text-align:left;font-size:12px;"> <u>''Figure 12''</u> </div> | ||
| − | + | * Methylosomolene was emitted by the factory Radiance-11/4/2016-3:00 PM | |
Latest revision as of 22:56, 16 July 2017
|
|
|
|
|
Question 1
Characterize the sensors’ performance and operation. Are they all working properly at all times? Can you detect any unexpected behaviors of the sensors through analyzing the readings they capture?
Month: April
Using of box-plot shows some of the outlier readings which are consistently very high.
From the figure, monitor 3 and monitor 6 are consistently showing very high readings every day.
Month: August
We notice that the readings are very high for the monitor 3,4 and 6. Monitor 3 is the one with the highest readings.
Month: December
- We notice that very high readings are showing for monitor 3,4 and 6.
- Monitor 4 is showing the highest reading.
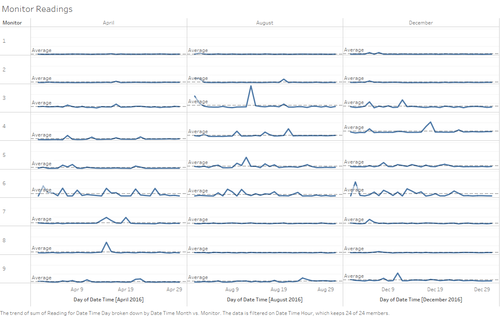
- From the above figure, it is evident that the readings from monitor 3,4, 5 and 6 are consistently showing more than average readings throughout the 3 months’ period whereas monitor 1, 2 and 9 are showing consistent readings.
- Also, if we consider the readings of 7 and 8 there is some spike in the month of April but no spikes in the month of August and December.
After we have looked into the raw readings of the sensors we now have a look at the no of readings picked up by each of the sensors around the factory vicinity.
Ideally the no of readings that are captured by each of the sensors should be equal!
From the readings obtained for the month of April, August and December it seems that whenever there is an increase in readings of chemical AGOC-3A there is a decrease in the readings of the chemical Methylosmolene.
Also we can see that the readings captured by each of the sensors are not the same throughout the every month.
Conclusion:
- From the raw readings and number of readings recorded it seems that Sensor 7 and 8 were showing different readings for the month of april for AGOC and Methylosmolene but in the month of August and December the readings were constant.
- For the sensors 3,4,5,6,9 the no of readings recorded seems to change a lot especially for the month of August whereas the no of readings from sensor 1 and 2 varies very little throughout the 3 months time.
Question 2
Which chemicals are being detected by the sensor group? What patterns of chemical releases do you see, as being reported in the data?
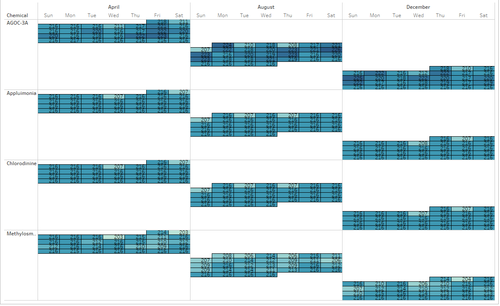
From the calendar plot we get some interesting insights from it. We notice that the number of records for the month of April is low for every chemical reading on the 2nd and 6th of the month. For august it is getting repeated for the 2nd,4th and 8th of the month For December, there is no peculiar pattern that we can find. In December, the chemical readings are changing for the 2nd and 7th of the month. Now let us see the readings of the chemicals throughout the different monitor readings.
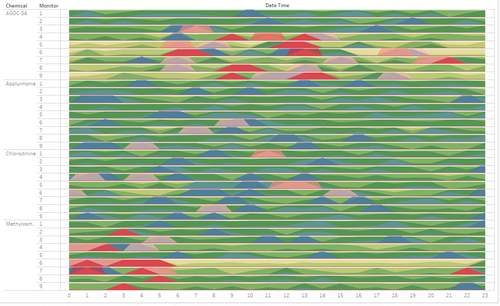
April Readings:
- AGOC-3A- monitor/sensor 4,5,6,8,9 are the group of monitors that are showing very high spikes in terms of readings mainly between 05:00 AM to 02:00 PM. Sensors 1 and 2 captures most of the readings throughout the day.
- Appluimonia- Monitor/sensor 6,7 and 9 are the groups of sensors that are showing very high spikes in readings.
- Chlorodinine-1,4,5,6,8 are the sensors group that captures most of the reading during 12:00 AM to 03:00 AM. Sensors 1,2,8 are able to capture the readings throughout the day.
- Methylosmolene-1,2,3,8 are the sensors that capture most of the readings throughout the day with sensors 4,6,7,8 showing high spikes only in the morning hours.
Here we have to see whether this pattern exists throughout rest of the months as well.
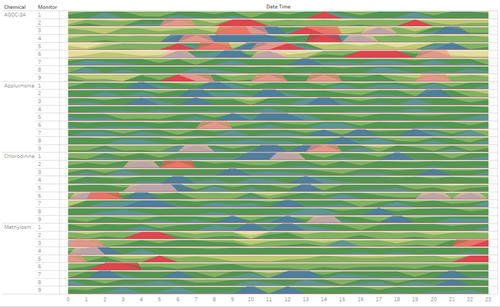
August Readings:
- AGOC-3A- sensors 3,4,5,6 captured very high readings for this chemical between 5:00 AM to 4:00 PM
- Appluimonia -2,3 and 9 are the sensors that captured this chemical reading.
- Chlorodinine-sensors 3,4,8 and 9 captured most of the readings of this chemical
- Methylosmolene-1,8,9 are the sensors that captured most of the readings here.
Whereas some spikes were observed by the sensors 2,5 and 6 during the time 12:00 AM to 6:00 AM
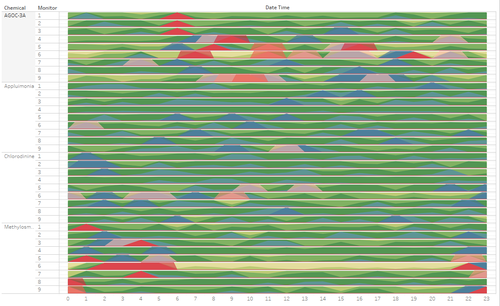
December Readings:
- AGOC-3A- Here the sensors 1,2,3 shows spikes in the readings at 6:00 AM where as the sensors 4,5,6 are picking up very high spike in the readings.
- Appluimonia – sensor 6 and 7 show high readings .
- Chlorodinine- sensor 5 and 6 here are showing some high readings.
- Methylosmolene-1,3,5,6,8,9 observed very high spikes in the readings during the night hours which seems to suggest that this chemical which is banned and most dangerous of all the chemicals are being released by the factory during the night hours. In our case, we observe the spike in the readings from 10:00 PM to 6:00 AM
This trend is similar to the high spikes that was observed in the month of April. Also, it seems that this particular chemical shows spike in the morning hours but no spike between 6:00 AM to 10:00 PM which may suggest that the factories may have been neutralizing the chemical after 6:00 AM but at night they may not be doing so.
Question 3
Which factories are responsible for which chemical releases? Carefully describe how you determined this using all the data you have available. For the factories you identified, describe any observed patterns of operation revealed in the data.
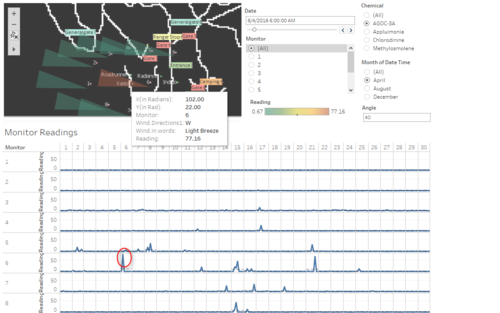
- The Chemical Agoc-3A was emitted by Kaiso and Road Runner- Time 6/4/201-6:00 AM
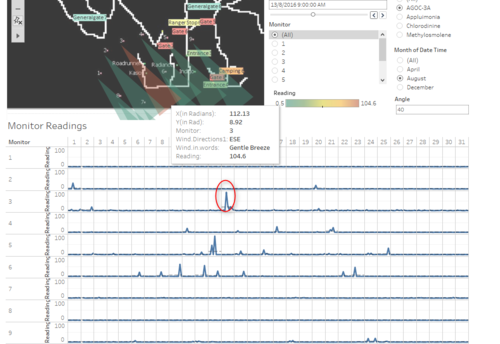
- The Chemical Agoc-3A was emitted by Kaiso and Roadrunner-12/8/2016-9:00 AM
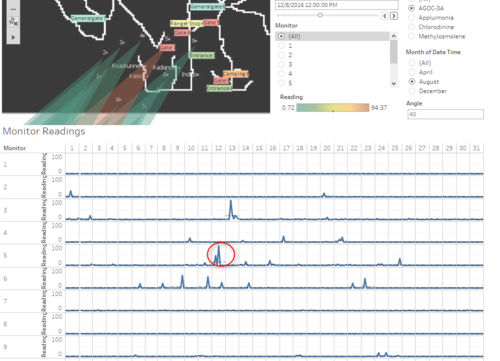
- The Chemical Agoc-3A was emitted by Kaiso and Roadrunner-12/8/2016-12:00 PM
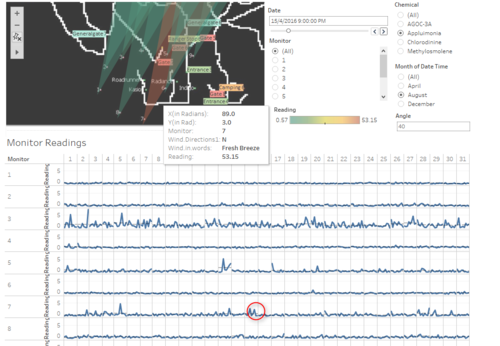
- Applumonia was emitted by the factory Radiance-15/4/2016-9:00 PM
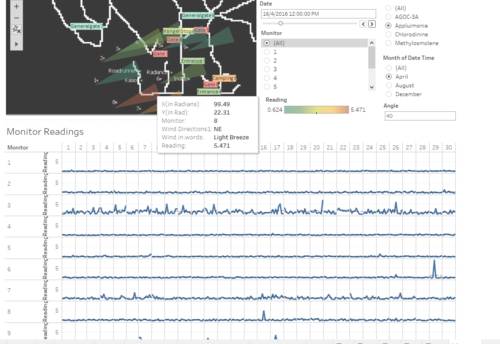
- Applumonia was emitted by the factory Radiance and indigo-16/4/2016-12:00 PM
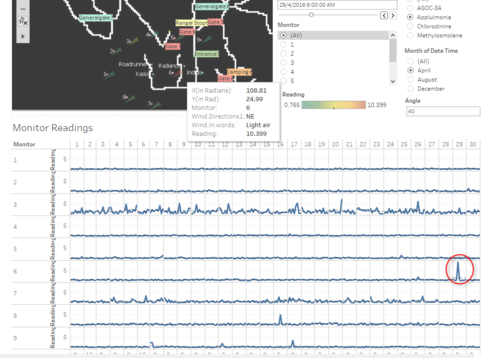
- Applumonia was emitted by the factory Radiance-29/4/2016-9:00 AM
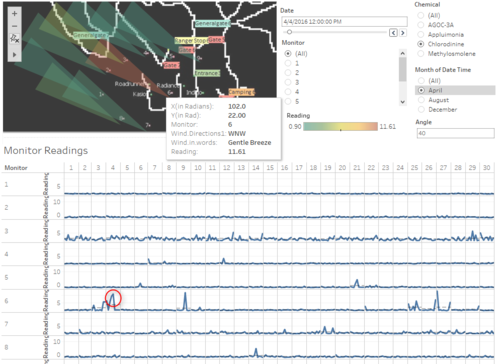
- Chlorodinine was emitted by factory RoadRunner-4/4/2016-12:00 PM
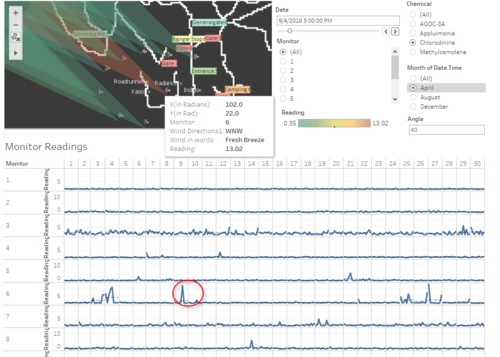
- Chlorodinine was emitted by factory RoadRunner-9/4/2016-5:00 PM
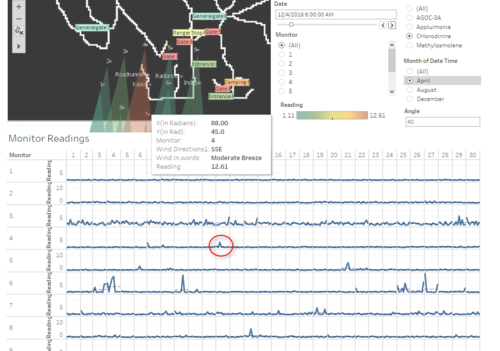
- Chlorodinine was emitted by factory RoadRunner and Kaiso-12/4/2016-6:00 AM
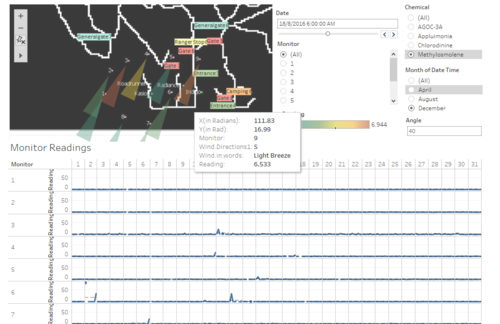
- Methylosomolene was emitted by the factory Indigo-18/8/2016-6:00 AM
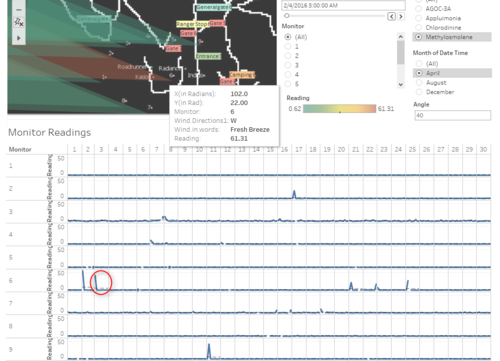
- Methylosomolene was emitted by the factory Kaiso-2/4/2016-3:00 AM
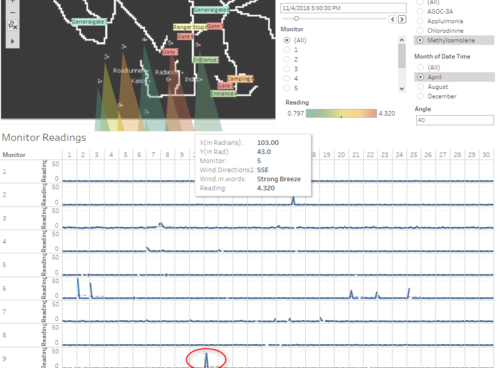
- Methylosomolene was emitted by the factory Radiance-11/4/2016-3:00 PM

