Difference between revisions of "Interactive Dashboards Q3 Sumalika"
Jump to navigation
Jump to search
(Created page with "<font size = 4; color="#001a66"><span style="font-family:Century Gothic;">'''Dashboard for Chemicals Released'''</span> </font> <br/> File:Sumalilka_Dashboard_5.jpg|800px|c...") |
(No difference)
|
Revision as of 12:30, 16 July 2017
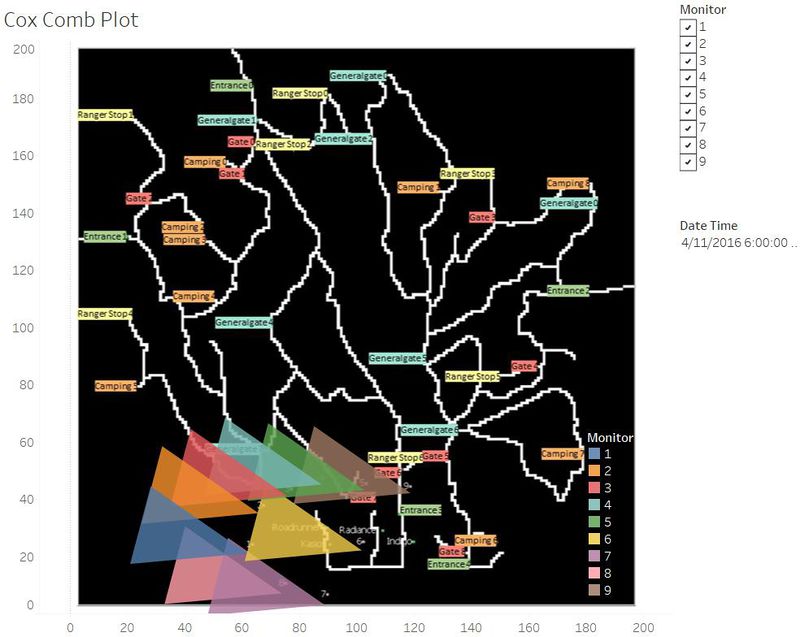
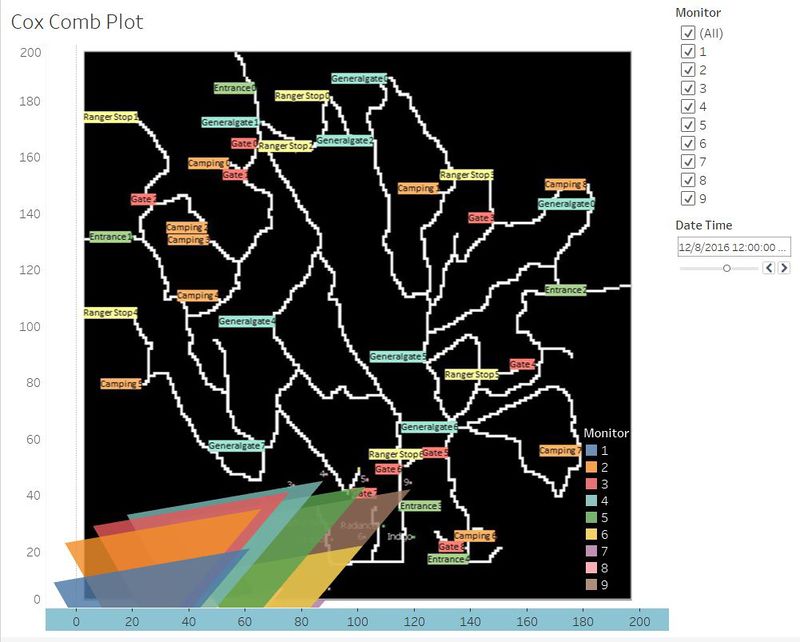
Dashboard for Chemicals Released

Dashboard 1 consists of a cox comb plot filtered on date and monitors
Interactivity:
On selecting a date, the behavior of the wind is seen with respect to every sensor. For example, on the 12th August, a reading of 84.6 is observed and the factory that is responsible for the release of the chemical is Kasios Office Furniture
