Difference between revisions of "Interactive Dashboards Q2 Sumalika"
Jump to navigation
Jump to search
(Created page with "<font size = 4; color="#001a66"><span style="font-family:Century Gothic;">'''Dashboard for Chemicals Released'''</span> </font> <br/> File:Sumalika Dashboard 3.jpg|800px|ce...") |
(No difference)
|
Revision as of 12:15, 16 July 2017
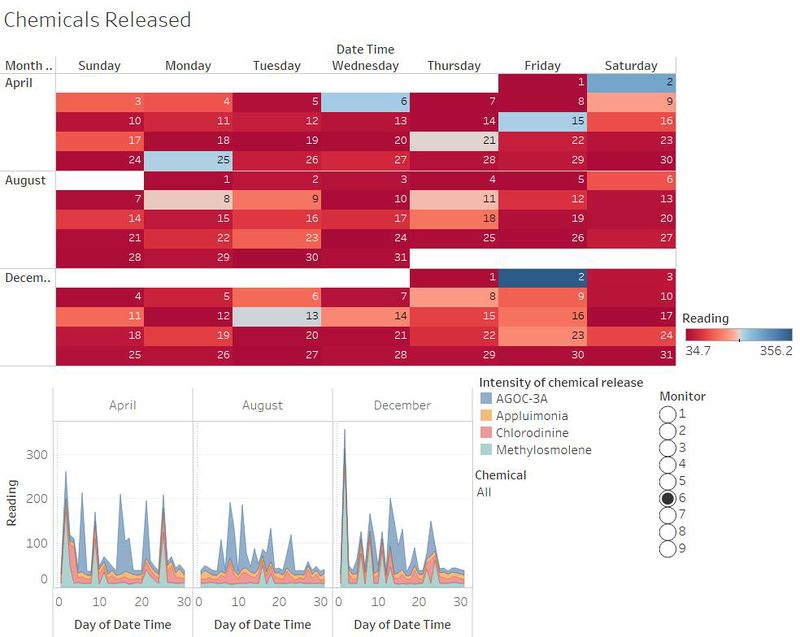
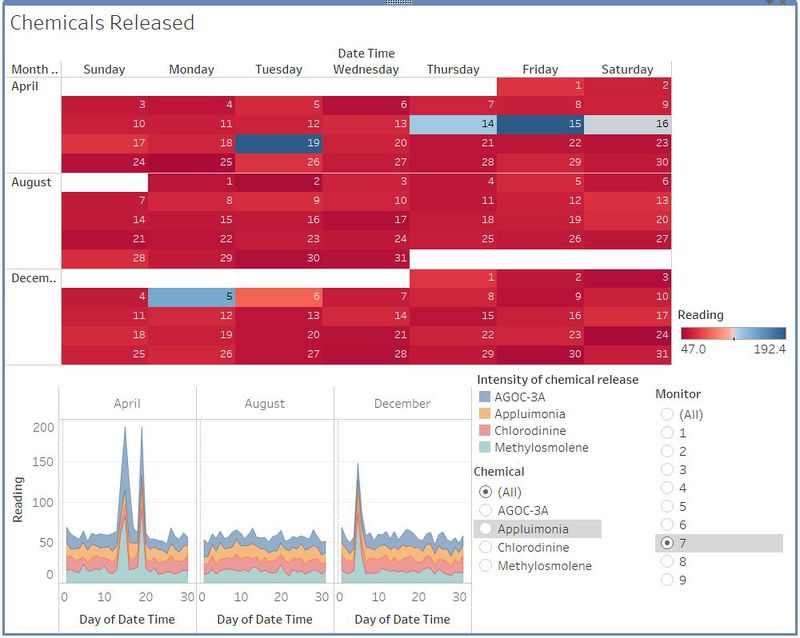
Dashboard for Chemicals Released

Dashboard 1 consists of a calendar plot with Monitor readings and the sum of readings of each chemical recorded by a sensor.
Interactivity:
On selecting a monitor, the readings with high values get highlighted on the calendar plot and the stacked graph shows the day and hourly readings of the chemical. In the below graph it is evident that Methylosmolene, a harmful chemical was released in high quantities
