Difference between revisions of "Interactive Dashboards Q1 Sumalika"
Jump to navigation
Jump to search
(Created page with "<font size = 4; color="#001a66"><span style="font-family:Century Gothic;">'''Dashboard for Sensor Performance'''</span> </font> <br/> File:Sumalika Dashboard1.jpg|800px|cen...") |
(No difference)
|
Revision as of 12:05, 16 July 2017
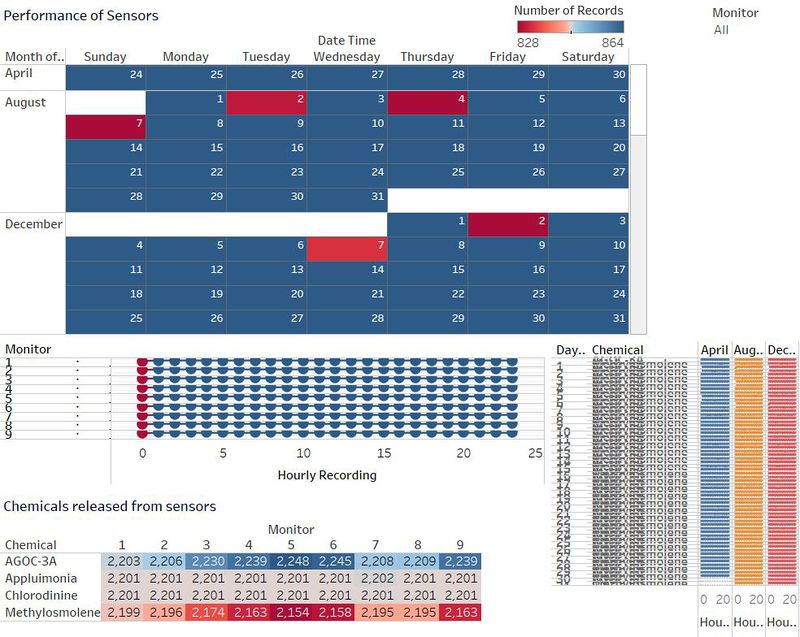
Dashboard for Sensor Performance

Dashboard 1 consists of a calendar plot with Monitor readings and the number of records for each chemical recorded by a sensor.
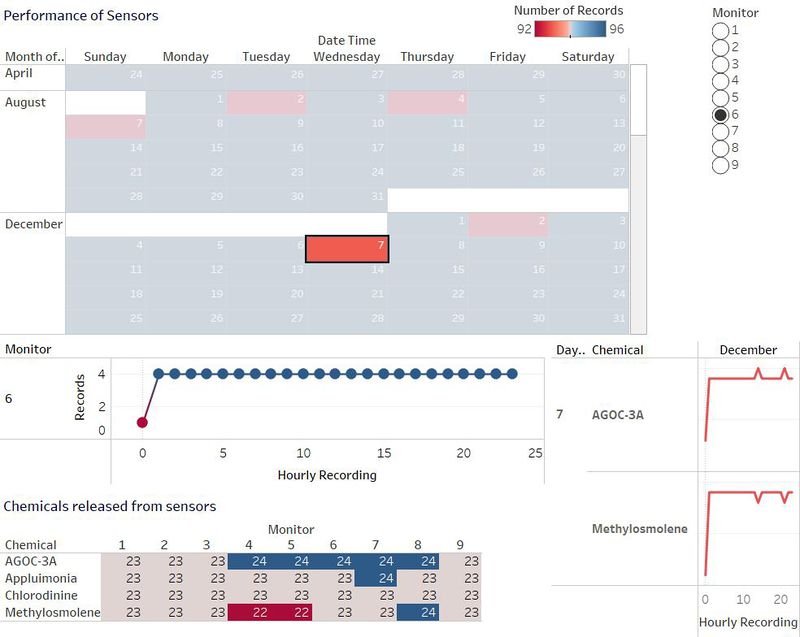
Interactivity:
On selecting the Monitor 7, The days with low number of records captured under a chemical is seen in the heat map. December 7th has less that normal. On clicking it, the number of records are seen on the dual axis line graph and the chemicals with more number of records along with chemical with less number of records is displayed.
