Difference between revisions of "Q3"
| Line 70: | Line 70: | ||
In conclusion,as predicted earlier while analyzing chemical release patterns we can say that the readings of chemicals captured by the sensors are affected by the wind speed. Further analysis needs to be performed on the wind direction and the factories that release these chemicals to gain better insights. | In conclusion,as predicted earlier while analyzing chemical release patterns we can say that the readings of chemicals captured by the sensors are affected by the wind speed. Further analysis needs to be performed on the wind direction and the factories that release these chemicals to gain better insights. | ||
| + | <br/> | ||
| + | |||
| + | In the previous question we have looked at the readings of each chemical on calendar plot, monitor wise and it was deduced that the Monitors 3,4,5,6,7,8,9 have captured high readings. In order to identify patterns at hourly basis, we used stacked graph. Both these plots can be used to identify the date and time that captured high readings and thereby identify the factory that is responsible for chemical release with the help of a cox comb plot. | ||
| + | <br/> | ||
| + | [[File:Sumalika_Q3P4.JPG|1500px|center|float]] | ||
| + | <br/> | ||
| + | The above chart shows high chemical release readings from monitor 3 during April, August and December. The overall highest reading is seen in December and is highlighted in the graph. Similarly all other monitors are analysed for high chemical release readings. Cox Comb plot is used to identify the factories that released these chemicals. | ||
| + | <br/> | ||
| + | [[File:Sumalika Q3.jpg|600px|right|float]] | ||
| + | The cox comb plot shows information about a single monitor 3, however this can be done for all monitors at a time. On the 11th of August at 3PM, AGOG - 3A release was recorded at 57.12 and the factory responsible for this release is Kasios Office Furniture. In the same way, analysis of each chemical is performed and the factories responsible for the high release of chemical is as follows: | ||
<br/> | <br/> | ||
Revision as of 09:26, 15 July 2017
|
|
|
|
|
|
WIND SPEED TRENDS:
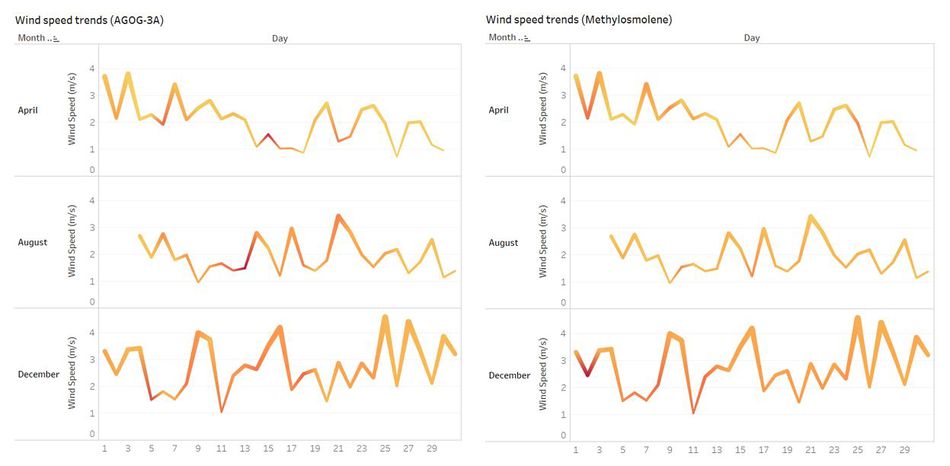
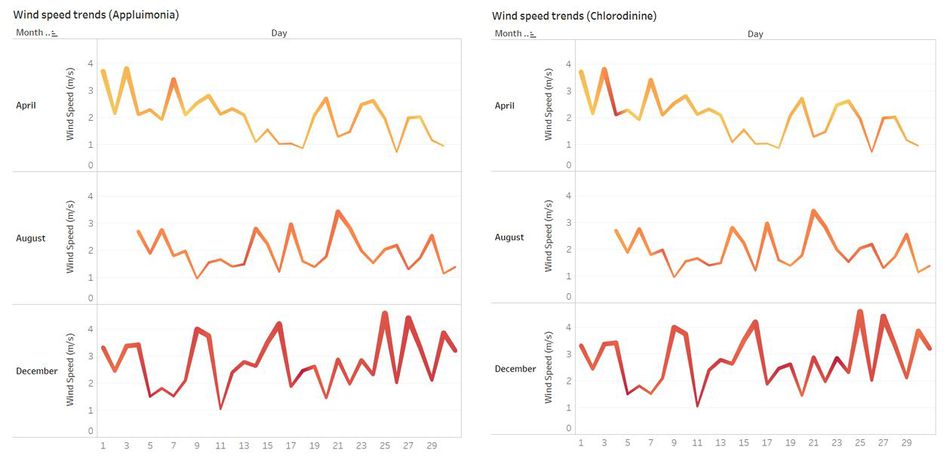
Wind speed analysis is done to understand the speed of the wind for each month and identify the day that experienced a lot of chemical release due to the wind speed. The charts shown describe the wind speed for each chemical released on a particular day. The color refers to the average reading of chemical and the thickness of the lines represent the wind speed intensity.
There is no wind data available from 1st August to 3rd August. So the findings are based on rest of the days in July, August and December.
Wind speed trends for each chemical:
1. AGOG- 3A:
In July, when the wind speed was low, the sensors were able to capture AGOG-3A release; Hence the high amount of AGOG-3A release on the two days is due to the wind speed being low and on the other days since the wind speed was high, the chemical readings captured is low.
In August, 13th experienced a high reading of this chemical , and all the peak wind speed days experienced above average AGOG -3A release.
In December, above average release of AGOG-3A is uniformly observed throughout the month. Hence we can that the reason for not seeing high AGOG-3A value is because of the wind speed.
2. METHYLOSMOLENE:
July and August have relatively low reading and the wind speed has no impact on the release of Methylosmolene.
In December, it is observed that on the days of low wind speed, the release of Methylosmolene is high when compared to the days with high wind speed.
3. APPLUIMONIA:
Compared to three months, December shows high release of Appluimonia throughout the month independent of the speed of the wind.
4. CHLORODININE:
Cholorodinine also exhibits similar pattern as Appluimonia in its behaviour, however traces of excess release of this chemical is seen in April.
According to the analysis made earlier on the chemical release readings of Appluimonia and Cholorodinine, it was observed that the readings are low compared to AGOG- 3A and Methylosmolene. But the graphs here show a different picture. The release of is much higher than seen earlier. This could be the result of wind speed. December month has strong winds and this could be the reason for reading such high chemical releases.
In conclusion,as predicted earlier while analyzing chemical release patterns we can say that the readings of chemicals captured by the sensors are affected by the wind speed. Further analysis needs to be performed on the wind direction and the factories that release these chemicals to gain better insights.
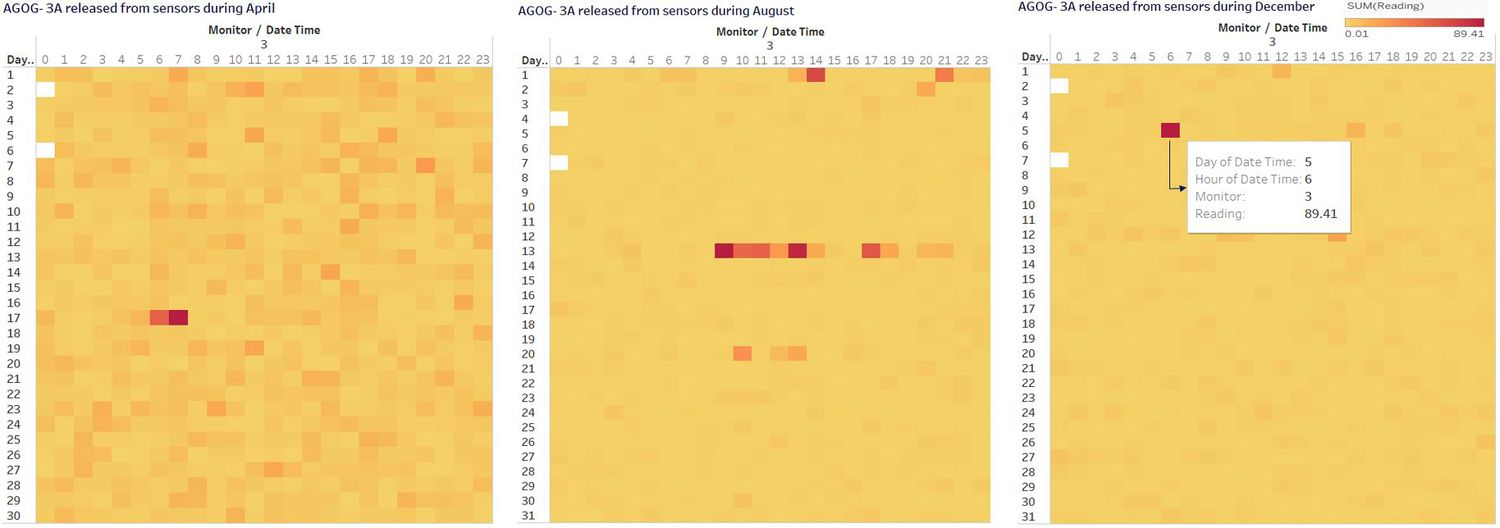
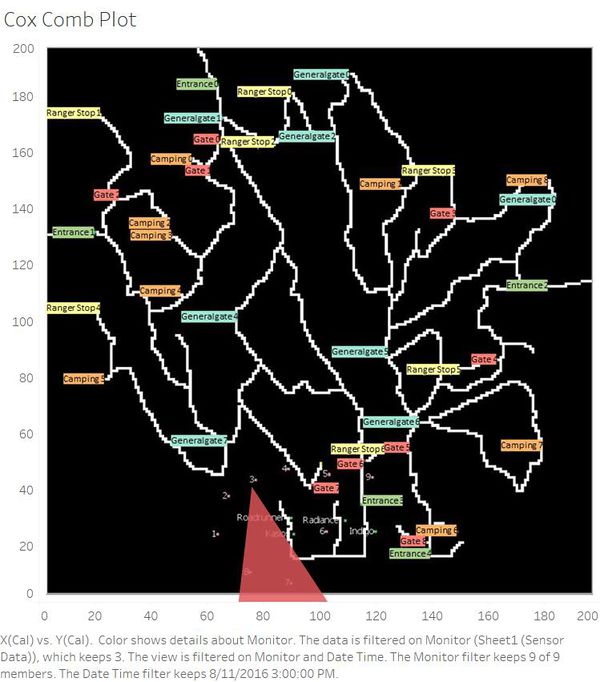
In the previous question we have looked at the readings of each chemical on calendar plot, monitor wise and it was deduced that the Monitors 3,4,5,6,7,8,9 have captured high readings. In order to identify patterns at hourly basis, we used stacked graph. Both these plots can be used to identify the date and time that captured high readings and thereby identify the factory that is responsible for chemical release with the help of a cox comb plot.
The above chart shows high chemical release readings from monitor 3 during April, August and December. The overall highest reading is seen in December and is highlighted in the graph. Similarly all other monitors are analysed for high chemical release readings. Cox Comb plot is used to identify the factories that released these chemicals.
The cox comb plot shows information about a single monitor 3, however this can be done for all monitors at a time. On the 11th of August at 3PM, AGOG - 3A release was recorded at 57.12 and the factory responsible for this release is Kasios Office Furniture. In the same way, analysis of each chemical is performed and the factories responsible for the high release of chemical is as follows:


