Difference between revisions of "ISSS608 2016-17 T3 SANDEEP Question 1"
Jump to navigation
Jump to search
(→Answer) |
(→Answer) |
||
| Line 33: | Line 33: | ||
<table width=90%> | <table width=90%> | ||
<tr> | <tr> | ||
| − | <td>[[File: Sandeep DP 1 5-22.jpg|480 px|left]]</td> | + | <td>[[File: Sandeep DP 1 5-22.jpg|480 px|centre]]</td> |
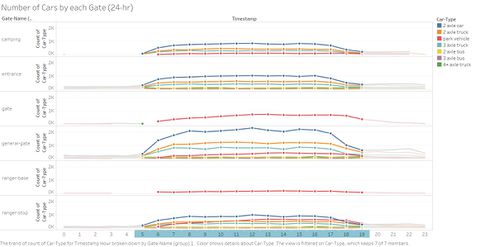
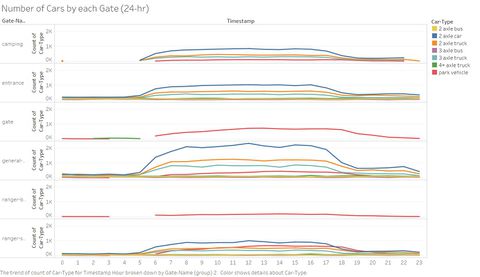
| + | <td>Vehicular traffic at each gate type is plotted. It is observed that the traffic was peak between 5AM and 7PM at gate types camping, entrance, ranger stop and general gate, general gate being the highest. It can also be observed that only the park vehicles labelled 2P had access to the gates which lead to ranger base, and hence the traffic at these locations was comparatively less. General gate which was located at different locations in the preserve is well used by all vehicles.</td> | ||
| + | </tr> | ||
| + | </table> | ||
| + | |||
| + | <table width=90%> | ||
| + | <tr> | ||
| + | <td>[[File: Sandeep Daily pattern 1.jpg|480 px|left]]</td> | ||
| + | <td></td> | ||
</tr> | </tr> | ||
</table> | </table> | ||
| − | |||
<table width=90%> | <table width=90%> | ||
<tr> | <tr> | ||
<td>[[File: Challa vehicle density.jpg|480 px|left]]</td> | <td>[[File: Challa vehicle density.jpg|480 px|left]]</td> | ||
| + | <td></td> | ||
</tr> | </tr> | ||
</table> | </table> | ||
| Line 49: | Line 57: | ||
<tr> | <tr> | ||
<td>[[File: Challa vehicle density 2.jpg|480 px|left]]</td> | <td>[[File: Challa vehicle density 2.jpg|480 px|left]]</td> | ||
| + | <td></td> | ||
</tr> | </tr> | ||
</table> | </table> | ||
Revision as of 20:21, 13 July 2017
|
|
|
|
|
Question
“Patterns of Life” analyses depend on recognizing repeating patterns of activities by individuals or groups. Describe up to six daily patterns of life by vehicles traveling through and within the park. Characterize the patterns by describing the kinds of vehicles participating, their spatial activities (where do they go?), their temporal activities (when does the pattern happen?), and provide a hypothesis of what the pattern represents (for example, if I drove to a coffee house every morning, but did not stay for long, you might hypothesize I’m getting coffee “to-go”). Please limit your answer to six images and 500 words.
Answer
| Vehicular traffic at each gate type is plotted. It is observed that the traffic was peak between 5AM and 7PM at gate types camping, entrance, ranger stop and general gate, general gate being the highest. It can also be observed that only the park vehicles labelled 2P had access to the gates which lead to ranger base, and hence the traffic at these locations was comparatively less. General gate which was located at different locations in the preserve is well used by all vehicles. |


