ISSS608 2016-17 T1 Assign1 Arcchit Mittal
Abstract
The data is about the resale price of public housing and has quite a good range of information for analysis, like resale flat prices based on date of registration, town, flat type/model and lease commencement date. The data is from 2012 till Q2 of 2016. Distribution of resale price by town, flat type, flat model, storey range, etc. will be taken into consideration. Using the information, distribution of price and trends in first half of 2015 will be compared with first half of 2016. The results will be depicted by many infographics based on the data in use.
Problem and Motivation
“The public housing resale market has continued on its long stabilisation path”, according to Singapore Real Estate Exchange (SRX) in a Straits Times article dated 5 Aug 2016. This is the news that one wants to hear. Purchasing a house in Singapore means a big investment. Therefore, a person should know all the aspects of the information. The following study is to get the insights from resale prices of public housing data and compare data of 2015 and 2016 to get a overview of the resale prices. A person can look at the results and compare prices of 2015 and 2016 based on different aspects, which will help in making a good investment.
Approaches
For visualization of the data firstly, the data has to be acquired. Secondly, there were some fields whose format has to be changed and some new fields has to be created and finally, different visualization techniques were applied.
1. Data Acquiration
To meet our goal the first step was to acquire data. The data was acquired from the Singapore Government database (https://data.gov.sg/dataset/resale-flat-prices). As we need the data with the information of prices from 2015 and 2016, we used the file named “Resale Flat Prices". The data was March 2012 Onward and covered till June 2016.
2. Data Preparation
The data that was acquired was clean and no missing values were noticed. But, the format of the date field was set as string which has to be changed to date, for that we used a formula. Two new fields "Age of flat" and "Resale Pice psm" were created.
3. Data Analysis
Different visualization techniques were used, mainly descriptive, to get the information we want. For comparing the data of 2015 and 2016 only the first half i.e. Q1 and Q2 was considered from 2015 in every visualization as the data acquired from the database have records of first half of 2016. So, the comparison will only be relevant if we consider only the first half of 2015 and compare. In all the visualization only the first half of 2015 have been taken into consideration.
Tools Utilised
Tableau
Only tableau was used as data analysis tool from data preparation to visualization of data. While preparing the data, format of date fields were changed and two new fields were created.
Transformation
- Conversion of Date field: The Date field of the data set was in the format YYYY-QQ and was treated as string character field by Tableau. To convert to a date format, the following formula was used on the Month column: DATEADD('month',INT(RIGHT([Month],2))-1,DATEADD('year',INT(LEFT([Month],4))-1900,#1/1/1900#)).
- Standardisation of Lease Commencement Date: The Lease Commencement Date was actually in YYYY format and was treated as string character. Conversion was done using the formula: DATEADD('year',INT([Lease Commence Date])-1900,#1/1/1900#).
New Fields
- Calculating a proxy for flat age: Given the standardisation of dates above, the age of flat can be calculated by getting the difference between transaction date and lease commencement date. The formula used was ([Year-Month]-[Lease commencement year])/365. The calculated field is rounded down to a whole number using if [Age of flat]=int([Age of flat]) then [Age of flat] elseif [Age of flat]<0 then int([Age of flat]) else int([Age of flat]+1) end.
- Calculating the price per square metre of resale prices: The prices in the resale transactions were the actual price of the whole unit. For a more detailed comparison, the prices were converted to price per square meter (psm) using [Resale Price]/[Floor Area Sqm].
Result
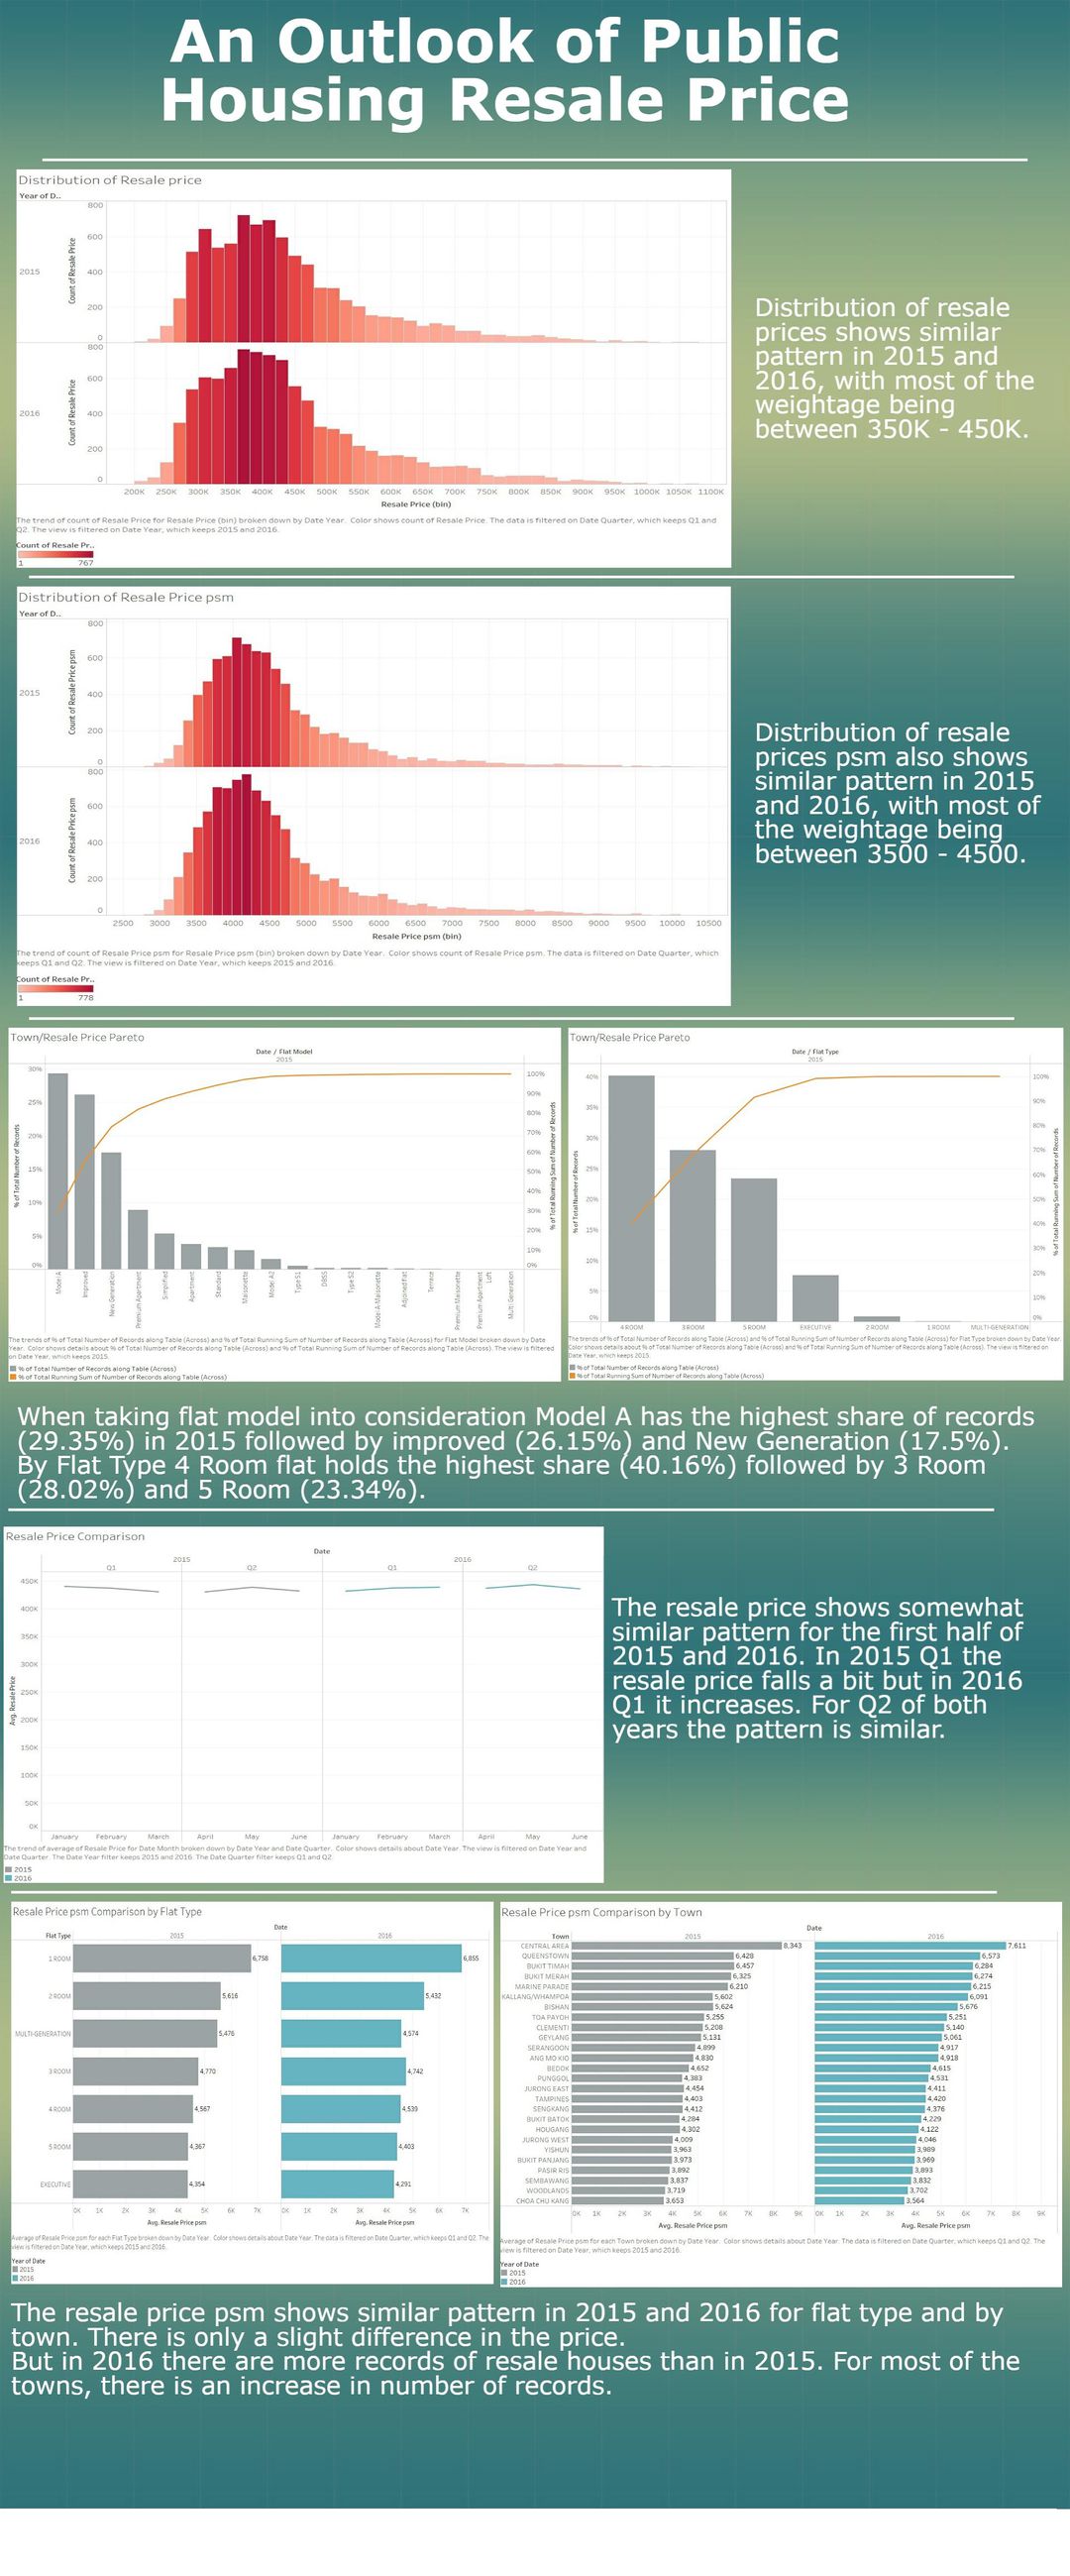
The outcomes are depicted from the following graphs. The resale price distribution, price distribution by storey range, town, flat type, flat model have been taken into consideration.
Infographic
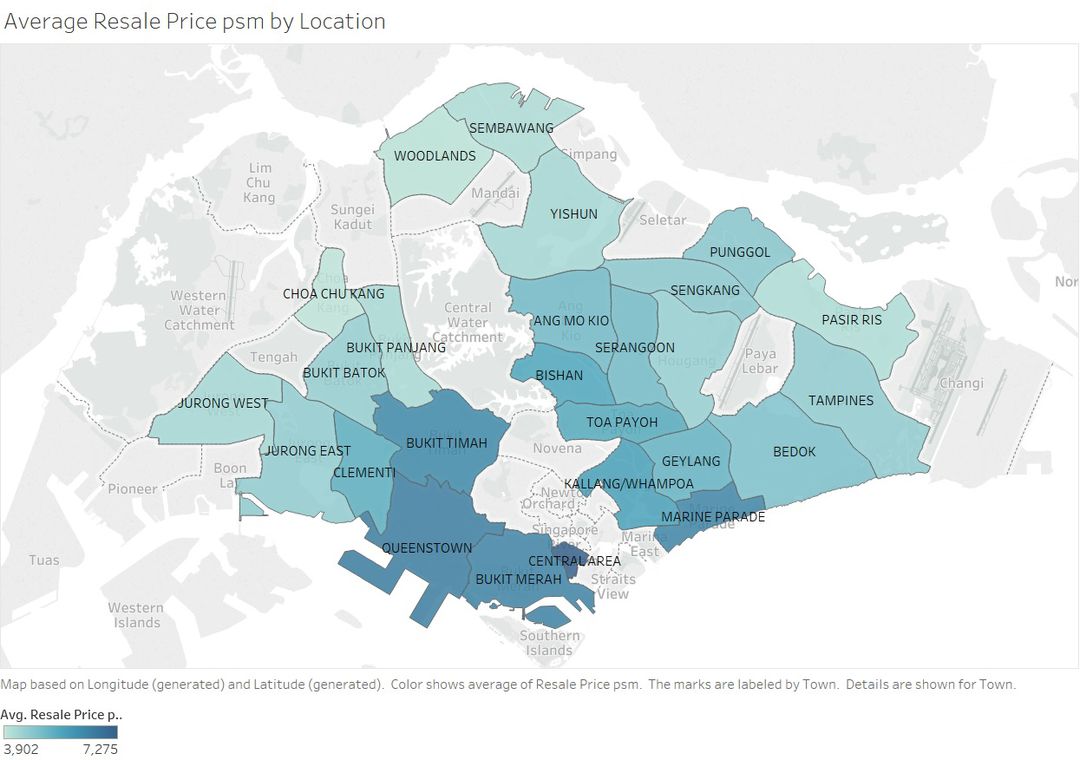
Variation of average resale price psm. The price increases as the shade gets darker. Here, the highest price is in Central Area, Queenstown.
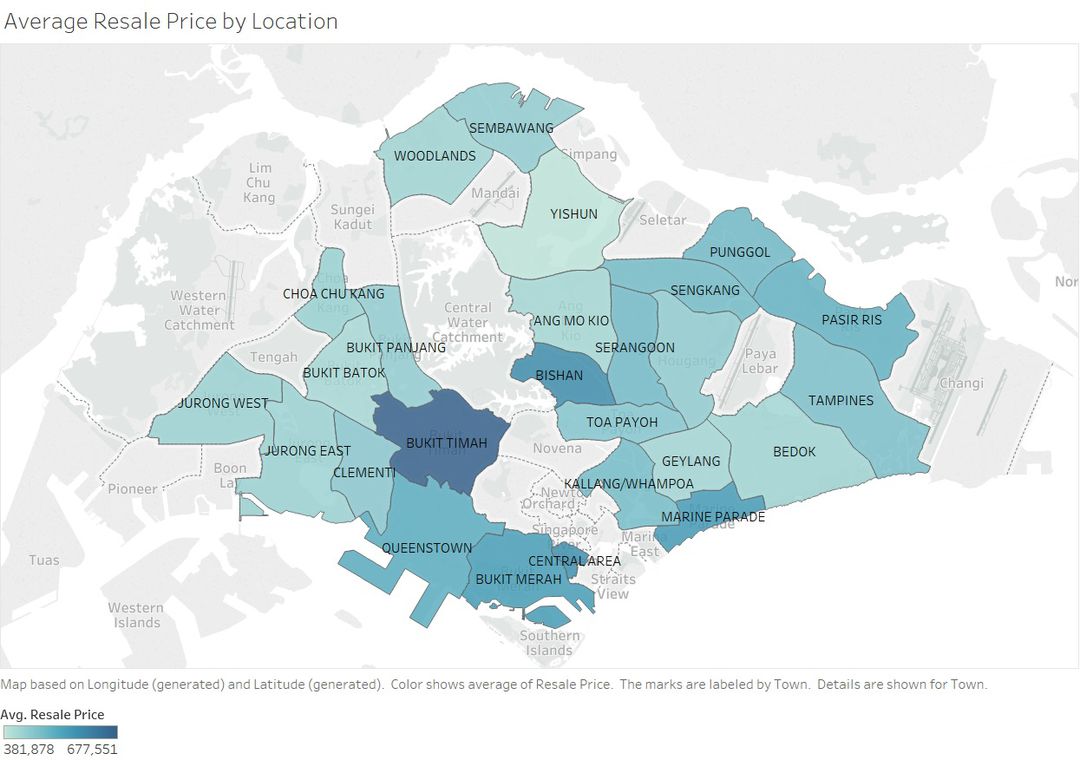
Variation of average resale price. The price increases as the shade gets darker. Here, the highest price is in Bukit Timah, Central Area.
Storey Range
From this graph we can tell that the upper most storeys have the highest price as compared to lower storeys. When comparing the data of 2015 and 2016 there is not much difference between the resale price psm for each storey range in 2015 and 2016. In 2016 the prices have increased for most of the ranges and for some it has decreased.
Flat Model
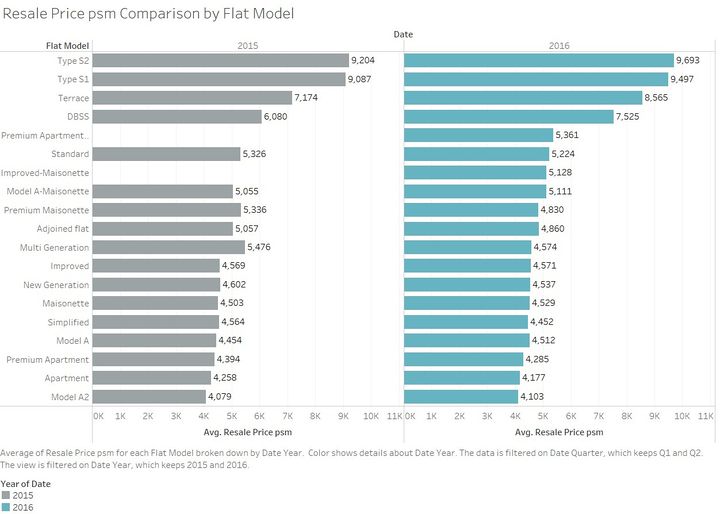
The resale price psm have increased in 2016 as compared to 2015 for some of the flat models and for some it has decreased. While for others there has been only a slight change.
Price Distribution By town
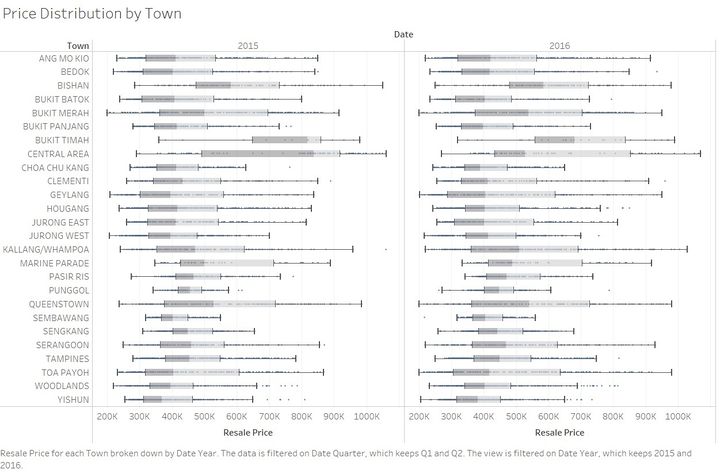
We can see the price distribution by town for 2015 and 2016. There is only a sight change in the prices of houses in each town. In central area the distribution of price is very large therefore, prices of the different streets of central area is to be visualized.
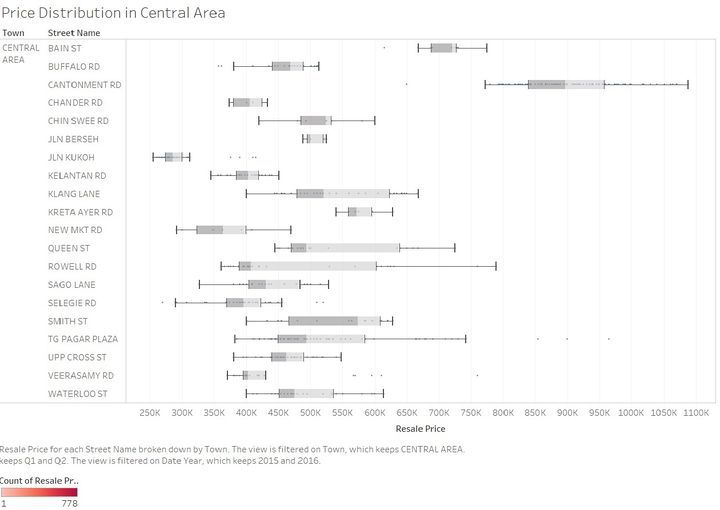
Central Area
From this graph we can see that the prices at Cantonment road and Bain Street are very high and probably the cause for such large price distribution in Central Area.
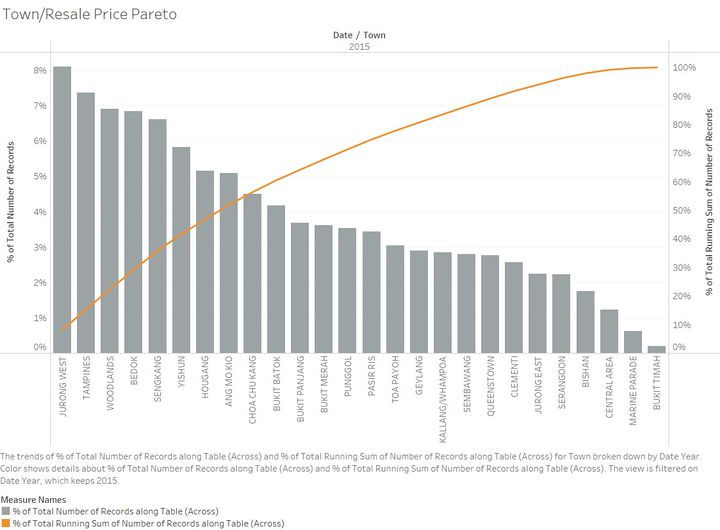
Town
The highest share of records are at some of the new towns like Jurong West, Tampines and Woodlands. Jurong West comprises of around 8% of the total records and Tampines & Woodlands comprises of around 7% each of the total records. In all the distribution of records have been fairly distributed all over the island.
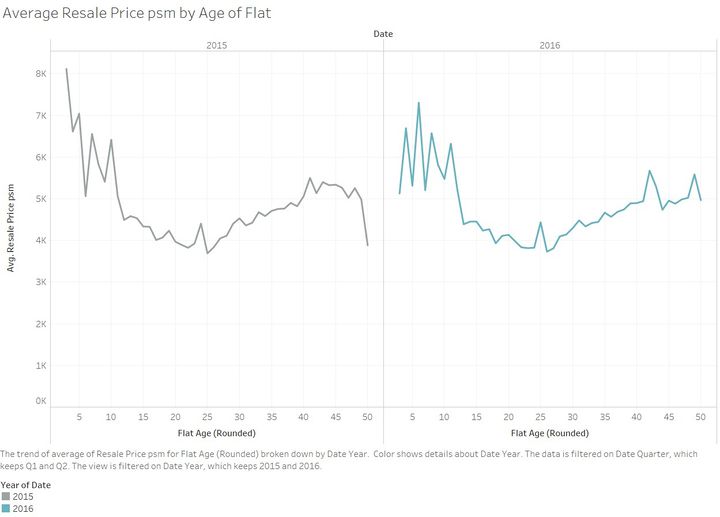
Age of Flat
Here we can see the trend of resale price psm with respect to the age of the flat in 2015 and 2016. The prices dropped for the newest leased buildings in 2016 and the trend thereafter is similar to that in 2015. But, one more thing can be concluded that the prices again increases for the old buildings between the range of 35 to 45 years.
