ISSS608 2016 17 T1 Project Team 12 Report
|
|
|
|
|
|
Contents
- 1 Introduction
- 2 Theme of Interest and Motivation
- 3 Review and critique on past works
- 4 Design Framework
- 4.1 Data Preparation
- 4.2 Sunburst visualization to view the percent of HDB car parks across different areas.
- 4.3 Zoomable Sunburst to have a closer look of the parking system.
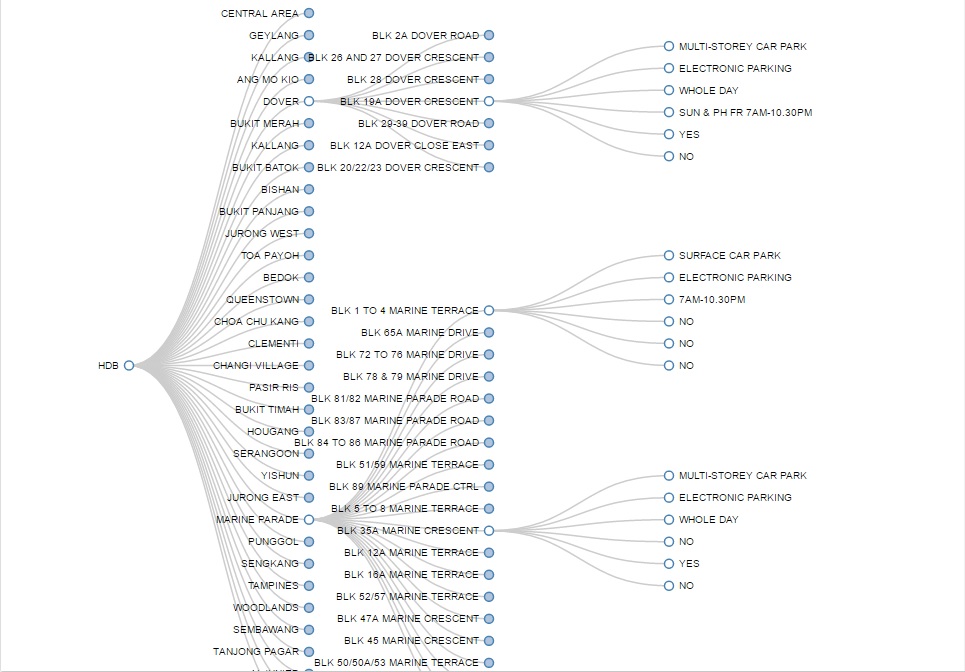
- 4.4 Tree Graph for visualizing hierarchical structure that explains different types of car parking systems.
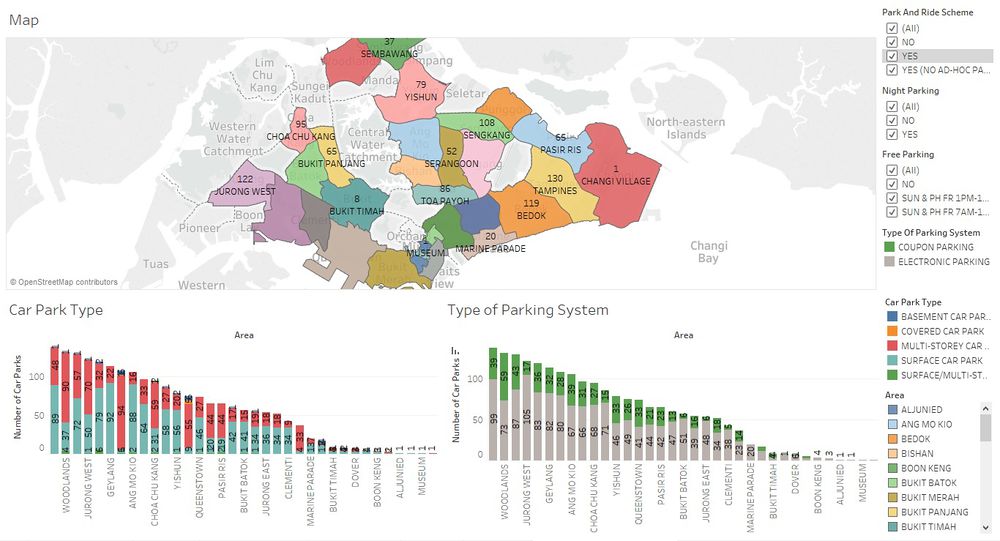
- 4.5 Interactive dashboard to view different type of parking systems in different areas.
- 4.6
- 5 Discussion
- 6 Future Works
- 7 Citations
- 8 Comments
Introduction
Singapore has a mature car parking system which the project aims to visualize the car park system currently implemented in Singapore and find insights of what types of car parkings are there and how they are distributed across the country.
The information about HDB carparks is obtained from data.gov.sg.
Theme of Interest and Motivation
Being a small country in terms of area but having high number of vehicles, Singapore has a very efficient and effective car parking system. So we are very intrigued with the management of parking in various manners across the country. By this project, we will create different visualizations that will help us develop insights which can explain different patterns of car parking systems in different areas of Singapore.
Review and critique on past works
All the data on the HDB housing was obtained from data.gov.sg
Design Framework
Data Preparation
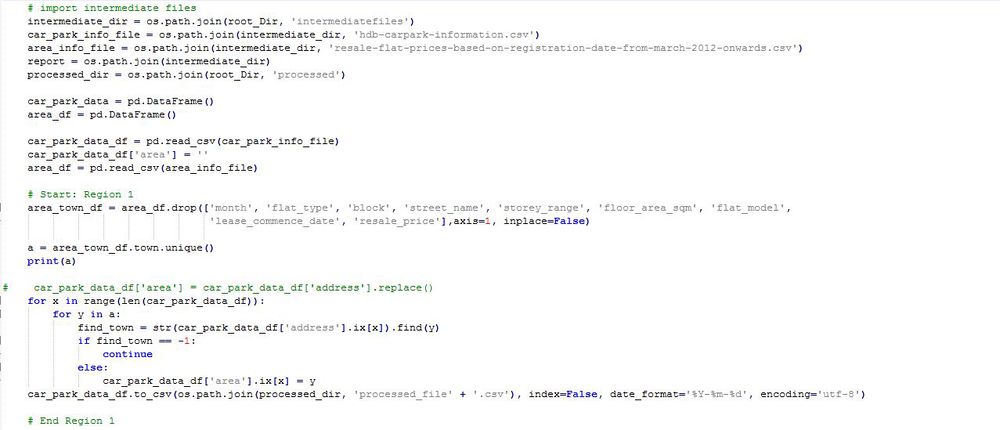
- The data available was quite small and did not have the area codes. As we decided to segregate the car parking based on the areas in Singapore, we processed the addresses of the parking lots and picked out the key areas for each parking. We used the HDB dataset from data.gov.sg to extract the key areas in which the country is divided. Following is the snippet of the python code that was used to do this processing.
- csv to json
Sunburst visualization to view the percent of HDB car parks across different areas.
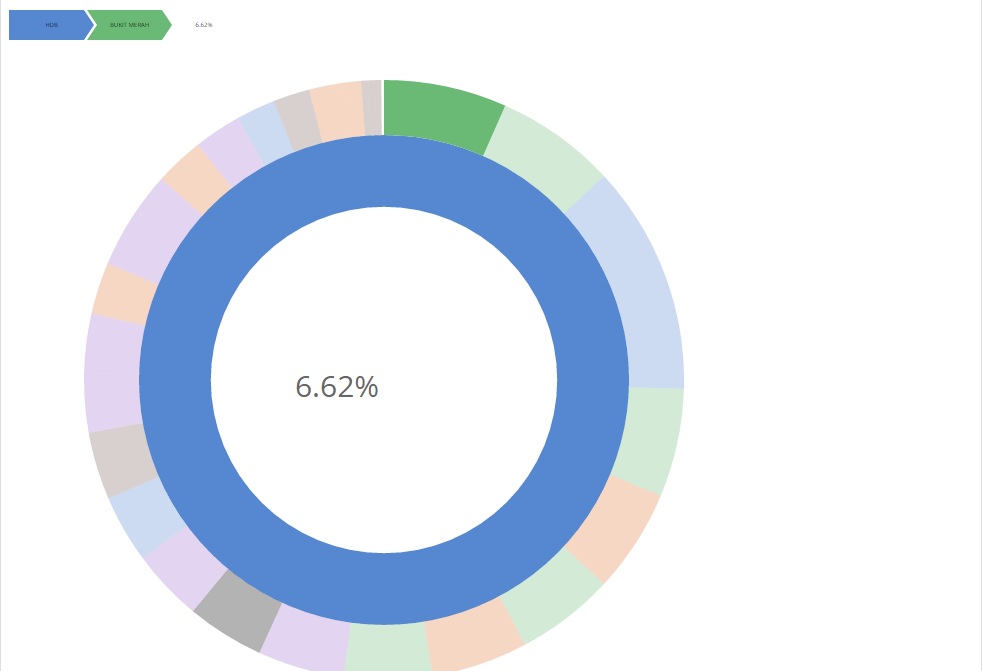
This diagram has been generated using d3.js. The name of this visualization is bread crumb sunburst and is used to see the distribution of HDBs in each of the locations
Zoomable Sunburst to have a closer look of the parking system.
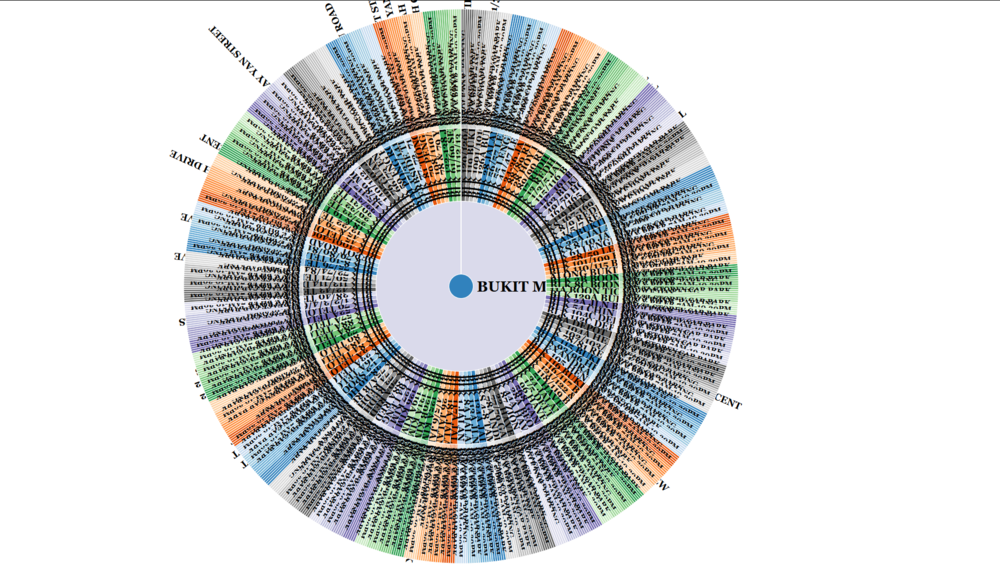
This diagram has been generated using d3.js. It helps us get an overall view of the entire dataset, and by clicking on each of the tabs we can zoom into each of the areas.
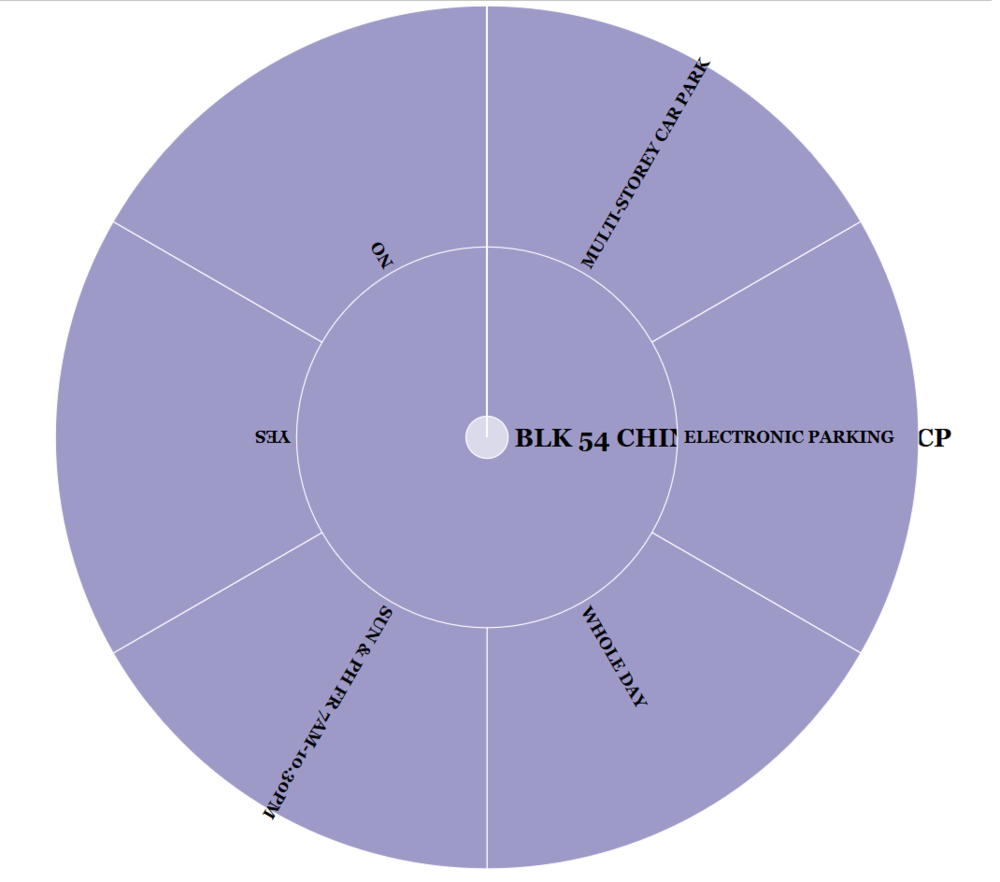
Tree Graph for visualizing hierarchical structure that explains different types of car parking systems.
Interactive dashboard to view different type of parking systems in different areas.
Discussion
Taking into account the visualizations that we created, we found some interesting insights from those which are mentioned below:
- Currently Bukit Merah has the maximum number of parking lots. This is based on the assumption that all the HDBs have equal number of parking lots. Bukit Merah has more than 6% of the total number of the HDB parking lots
- Currently of all the areas Jurong West has the highest number of electronic parking's
- Marine Parade is the only area with only Electronic Parking system
- Woodlands has the highest number of coupon parking's
- SengKang has the highest number of HDBs with multi-storey carparks, which is at 94
- Gaylang has the highest number of surface carparks, which is at 92
- Jurong West has the maximum HDBs with free carparkings between 7AM and 10:30PM on Sunday and PH
- Woodlands has the maximum number of HDBs with car parks for the entire day
- Woodlands and Bukit Merah have the maximum number of HDBs with Night Carparks
- Sembwang has the highest share of Night Carparks
- Downtown Area and woodlands have the highest number of night time parkings due the the large distribution of taxi parkings and residential areas
- Jurong West has very large number of free parking on saturday and sunday due to thee large number of people at Jurong Point
- Number of car parks are the highest in bukit Merah due its proximity to the down town area
Future Works
- Further analysis can be conducted on the datasets. After, visualizations the dataset can be further broken down and combined with parking costs, and predictive analysis can be conducted to minimize the parking costs
- The parking lot distributions can be further analysed so that there would be effective space utilizations of each of the parking spaces. We can prevent empty parking lots and over usage of free parking spaces using this analysis
Citations
Comments
