ISSS608 2016-17 T1 Assign3 Abhinav Ghildiyal Q3
When Vandalism happened?
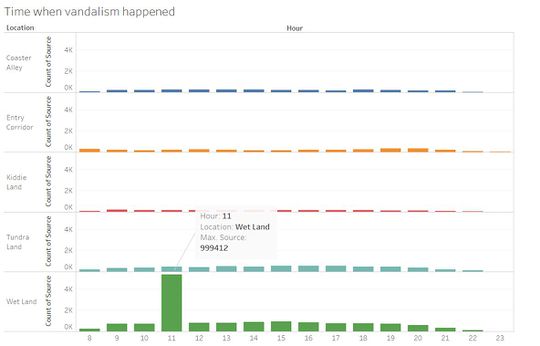
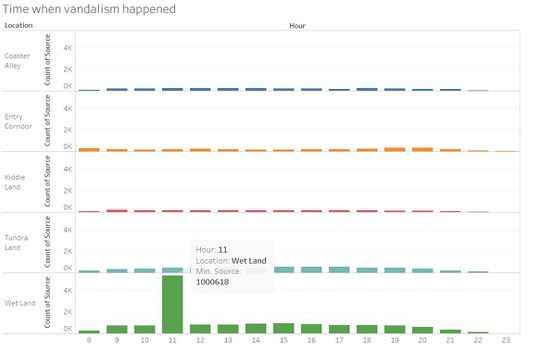
From the analysis I did, most of the patterns break on the 3rd day, i.e. on Sunday between 11 am to 12 pm. So there is a high probability that the vandalism might have occurred on Sunday between 11 am and 12 pm. Now, we will see some patterns that confirms that the vandalism happened on Sunday.
In the above visualization we can see that between 11 am and 12 pm there is a shoot in call from Wet Land and the Entry Corridor. Now if I select the Target as external we see a hike in calls from Wet Land to the external Id. ID 1000618 has done a minimum number of calls where as ID 999412 has done the max number of calls to the external Id.
Below is the graph showing the number of calls made by different Id`s from Wet Land to the ID 839736 at the same time there are almost the same number of calls made from the Entry Corridor by ID 839736.


