ISSS608 2016-17 T1 Assign3 Zhang Jinchuan
introduction
DinoFun World is a typical modest-sized amusement park, sitting on about 215 hectares and hosting thousands of visitors each day. It has a small town feel, but it is well known for its exciting rides and events.
One event last year was a weekend tribute to Scott Jones, internationally renowned football star. Scott Jones is from a town nearby DinoFun World. He was a classic hometown hero, with thousands of fans who cheered his success as if he were a beloved family member. To celebrate his years of stardom in international play, DinoFun World declared “Scott Jones Weekend”, where Scott was scheduled to appear in two stage shows each on Friday, Saturday, and Sunday to talk about his life and career. In addition, a show of memorabilia related to his illustrious career would be displayed in the park’s Pavilion. However, the event did not go as planned. Scott’s weekend was marred by crime and mayhem perpetrated by a poor, misguided and disgruntled figure from Scott’s past.
While the crimes were rapidly solved, park officials and law enforcement figures are interested in understanding just what happened during that weekend to better prepare themselves for future events. They are interested in understanding how people move and communicate in the park, as well as how patterns changes and evolve over time, and what can be understood about motivations for changing patterns.
In this essay will tell the approaches by data analytics tools for the three questions:
- Identify those IDs that stand out for their large volumes of communication. For each of these IDs Characterize the communication patterns you see.Based on these patterns, what do you hypothesize about these IDs?
- Describe up to 10 communications patterns in the data. Characterize who is communicating, with whom, when and where.
- From this data, can you hypothesize when the vandalism was discovered? Describe your rationals.
data explore
there are two parts of data,coummnication data and movement data. Communication data records how people communicate in the park. Movement data records the path people move in the park.
Because the volume of the data is quite big. So we can assump that only the large volumes of communication of people are the people we should focus on. By filtering the data we can deal with them and detective the crimes more easily. For example, choosing the tourists with large volumes communication record and regarding them as the satuarday communication data.
By noticing in the colume "to", there are "external" value, considering the people communicate with outside could be useless in the crimes analysis work, so delete them.
By using JMP tool, we can make some sheets showing the number of commnication, they can be useful in the next analytics work.
Approaches
Q1:Identify those IDs that stand out for their large volumes of communication. For each of these IDs Characterize the communication patterns you see.Based on these patterns, what do you hypothesize about these IDs?
Based on the communicate data, we can get one sheet having the number of record of every people's communication in two aspects, from and to. defining the top 10% of them are high communicaters. in these people, there are two people owned extremly high record, their IDs are: 1278894 and 839736.
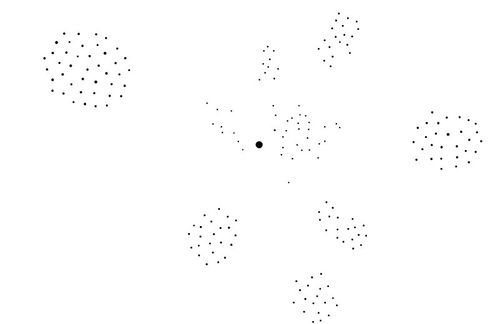
we can see these points more clearly in the Gephi graph, we can easily see they collect with almost every people, which means, they communicate with almost everyone. So based on this pattern, we can hypothesize they are the staff of the park, they are responside for the security of this park.
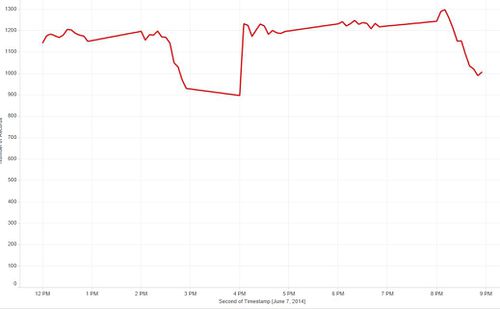
In addition, we can see their record of communication for the 12 work hours.
Q2:Describe up to 10 communications patterns in the data. Characterize who is communicating, with whom, when and where.
we can make a comparation about these tourists communicate with people who communicate high and people who are not frequency talking. By setting a new columes named Central ratio, which is the ratio of the number of these two kinds of people. Based on the ratio we can part them into three patterns, high, medium and low.
If we assume people moved or travel in groups, the large volumes communication people are the central points of groups. The first one patterns are the central points of the groups, which need frequency communicate with other groups. The second patterns and the third patterns are the rests of the groups, more accuracy, the second pattern should be higher level compared with the third pattern. So they do not need to communicate with others. The cases people communicate with external are normal since it is normal that people talked with their friends, colleagues and bosses.
According to the movement data, we found these people who moved a lot shared the same path. So we can assume they are in a same group. their IDs are: 160977, 1633069, 36415 and 67918.
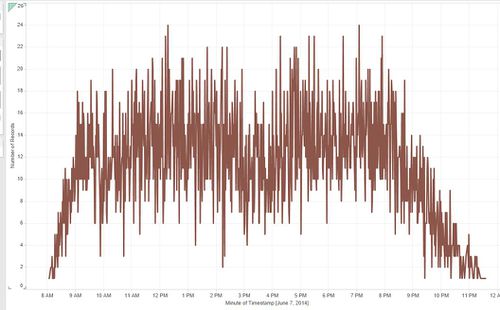
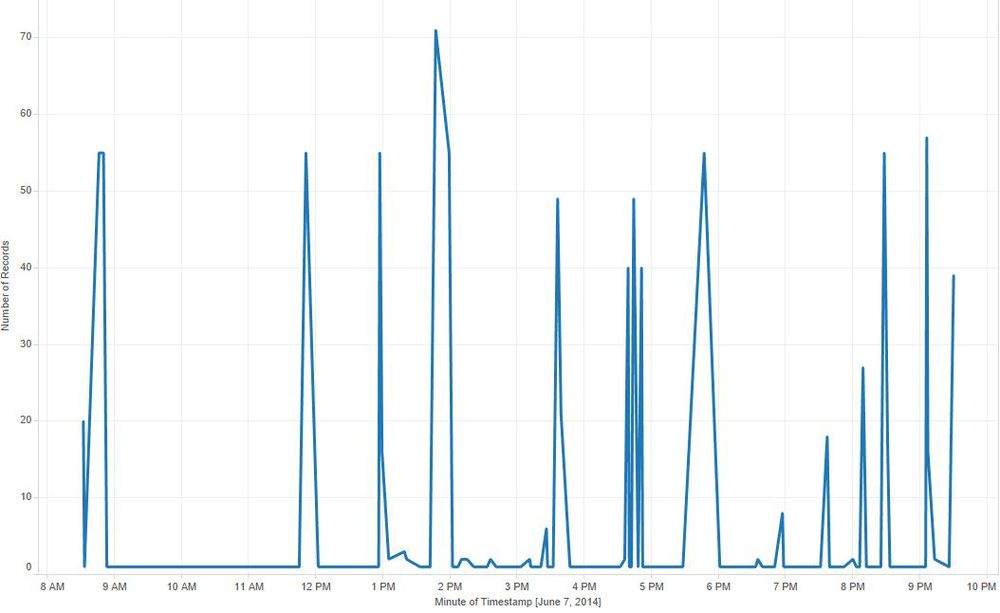
Based on the Gephi, we can see there are six groups, picked one particular group, we can get their IDs from the Gephi. then we can show how they move in the whole saturday. for example, in the righthead group, ID:873104. we can get his or her record of communication in the 12 work hours like this. he or she has peak in 2Pm.
In addition, we can get his or her path in the map like this.
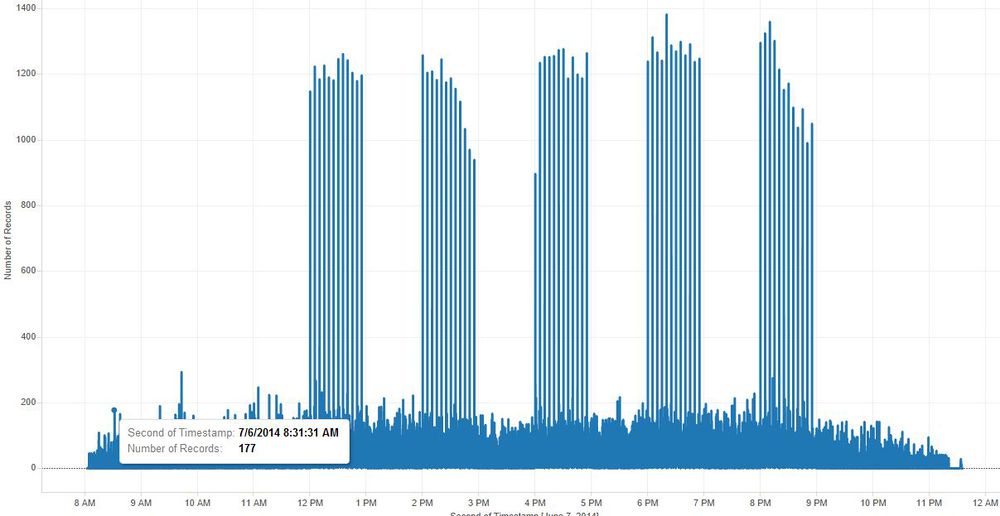
From the total record of communication, we can find that there are five pack parts in the 12 work hours.
Q3:From this data, can you hypothesize when the vandalism was discovered? Describe your rationals.
When the vandalism was discoverd the staff of Park would be quite busy, so we focused on the record of the staff. We can find there is a sharp increase in the 4:00pm. So I hypothesize the vandalism was discovered at 4:00pm in saturday.
summary
- There are two staff responsible for the security of the park, their IDs are:1278894 and 839736.
- There are six groups of communication parts at Saturday.
- I hypothesize the vandalism was discovered at 4:00pm Saturday.
future work
- There should be more work about conbine the communicate data and movement data together.
- More work should done about Sunday and Friday.
- There should be some tools can deal with big size data.
Tableau public link
https://public.tableau.com/profile/publish/movementwork/Sheet1#!/publish-confirm
https://public.tableau.com/profile/publish/communicationwork/Dashboard1#!/publish-confirm
