ISSS608 2016-17 T1 Assign3 CHIA Yong Jian
Contents
What Happened?
Based on the case information, this is what can be gathered:
- What event was going on? Scott Jones, an international football star, was to celebrate his years of stardom and appear in two stage shows each from Friday to Sunday. His memorabilia was to be displayed at the park's pavilion
- What was the crime? - Vandalism was discovered.
- Who did the crime? - A "poor, misguided and disgruntled figure from Scott’s past". The identity of the person is not known, yet.
- Where is the location of crime: Within At DinoFun World. Since Scott Jones's weekend include two events, the crime either happened at where his stage show is or where he is showing his memorabilia at the pavilion. Since the crime was on vandalism, it is likely that his items on displayed were vandalised. However, we will look into the communications and movement data to confirm that this is happening.
The DinoFun World website provides the following additional details:
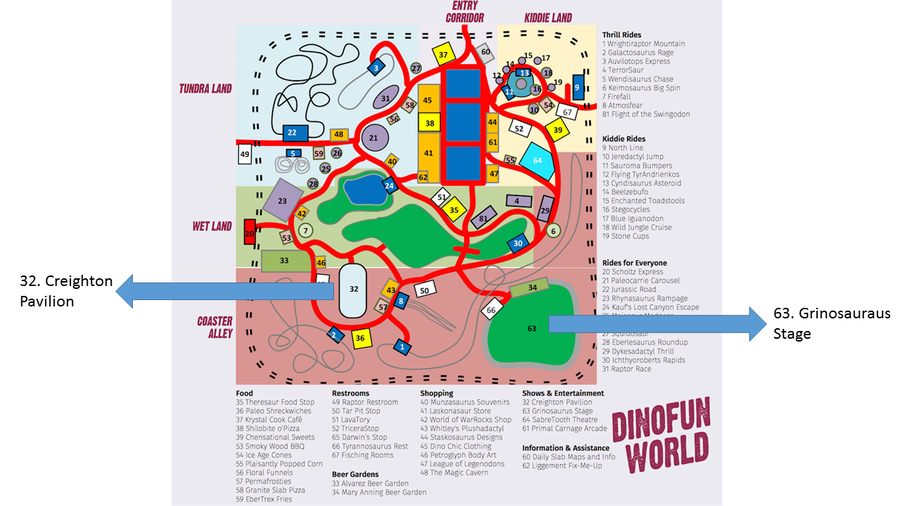
- The memorabillia exhibition is at the Creighton Pavilion (Entrance at Wet Land). No specific mention of where the stage show is at, although based on the park map, the park only have 1 location that is a stage - Grinosaurus Stage (Entrance at Coaster Alley).
- There is also a DinoFun World App that allows visitors to check-in at rides, SMS friends, which can be installed on the person's own phone or via devices borrowed from the park. In addition there is also a Cindysaurus trivia game embedded within the mobile application. It will be useful to examine the communications and movement data to observe patterns.
- Unfortunately, some information such as park opening and closing time is not available in the case information or on the DinoFun website.
Data Review and Preparation
SAS JMP Pro 12 was used to review and prepare data.
Communications Data
Three days worth of data (Friday, Saturday, Sunday) of the fateful weekend was provided, with each having between 948,739 to 1,655,866 records. Each file has the following columns:
| Column | Description | Remarks |
|---|---|---|
| Timestamp | in YYYY-MM-DD HH24:MM:SS format | - |
| from | unique identifier of the sender | All communications came from a unique identifier - no messages are sent by an "external" party |
| to | unique identifier number of the receiver | Receiver ID can be indicated as "external" as well - assuming external means to a party not in the park. |
| location | indicates where the message was sent from. | All messages came from one of the following areas in the park: Wet Land, Tundra Land, Kiddie Land, Entry Corridor, Coaster Alley |
No missing data was observed in the dataset.
For loading into Gephi later, the following columns will be renamed:
- "from" renamed to "Source"
- "to" renamed to "Target"
Movement Data
Movement data was also provided for the 3 days, with each having between 6 to 10 million records, and the following columns:
| Column | Description | Remarks |
|---|---|---|
| Timestamp | in YYYY-MM-DD HH24:MM:SS format | - |
| id | Unique identifier of the person making the movement | - |
| type | Either movement or check-in type | - |
| X | X-Coordinate of the location | Values are between 0-100 |
| Y | Y-Coordinate of the location | Values are between 0-100 |
The movement data, together with the park map, will be plotted using Tableau to visualise movement of the individuals in the park.
Which IDs have large amount of communications?
An exploration of the communications data was done in Tableau. The below shows the results
Overall Observations
Note: Bar charts are truncated on the right for aesthetic purposes.
By Source (Senders)
| Chart | Observation |
|---|---|
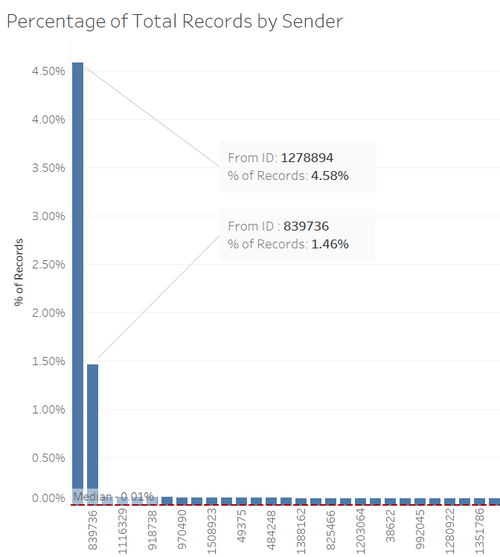
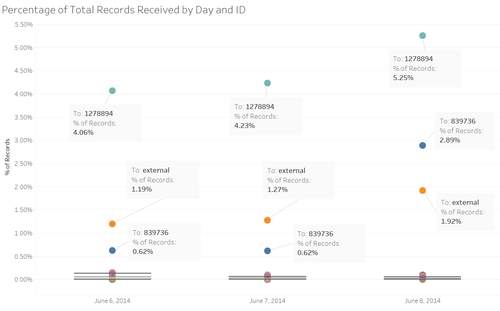
| There are two particular IDs that stands out for the number of communications sent across the three days - 1278894 and 839736, with a total of just over 6% of total communications. The median number of records sent as a percentage of the total records was just 0.01%. | |
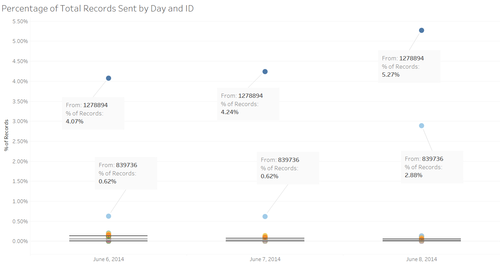
| When the observations was done by each day over the three-day period, both IDs still consistently show the highest percentage of records of the total communications sent. An interesting observation is that on Sunday (June 8), the percentage of communications sent by ID 839736 jumped in comparison to the other days. | |
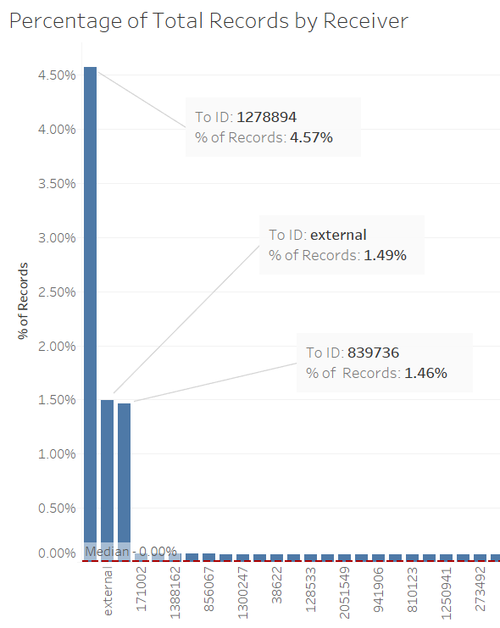
| The top three receivers of communications was ID 1278894 and 839736, and communications to "External" parties, making up a total of 7.52% records across the three days. | |
| When observed by each day, the top IDs for received communications remained consistent. An interesting observation is on Sunday (June 8) where there was a spike of communications to ID 839736. A drill down of data for this ID will be needed for further analysis to understand why the spike. |
Next, an investigation will be drilled down into the IDs identified above, except for "external" as there is no case information provided regarding external communications.
ID 1278894
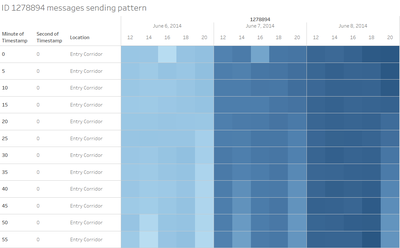
A simple table was constructed in Tableau with the timestamp timings displayed for this ID. The timestamp is changed to a discrete variable for this table. You can notice that this ID sends out messages right on the dot every 5 minutes, when it is active. Given the preciseness of the timestamps, it is hypothesized that this could be the Cindysaurus Trivia Game server sending messages to park visitors throughout the day.
ID 839736
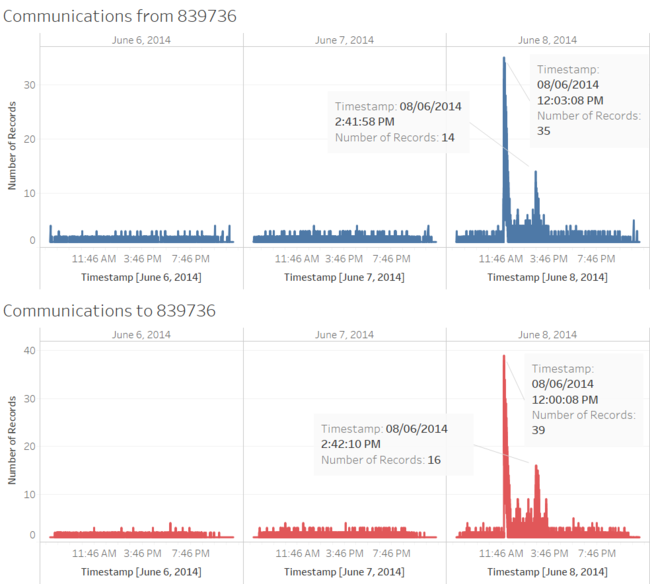
For this ID, the amount of communications remained generally flat on Friday and Saturday, but have large spikes on Sunday. Based on the timestamps, you will notice that there was a spike in messages sent to this ID at 12pm, with replies coming at 12.03pm. Secondly, at almost 2.42pm, there was also a spike in messages from this ID, with immediate responses from other IDs around 10 seconds later.
It is probably not possible if this ID is an individual, after all, to send so many messages to other park visitors at one time will likely be restricted in the app. The spike in the messages to and from may suggest some event or activity going on, causing the spike. If that's the case, this ID could possibly be the park information and assistance communications line for visitors to report and receive important information on what's going on in the park. This can be further strengthened by the fact that all communications from this ID came from the Entry Corridor location in the park, which is the entrance to the park.
10 Communication Patterns in the Data
Spike of messages sent to external parties
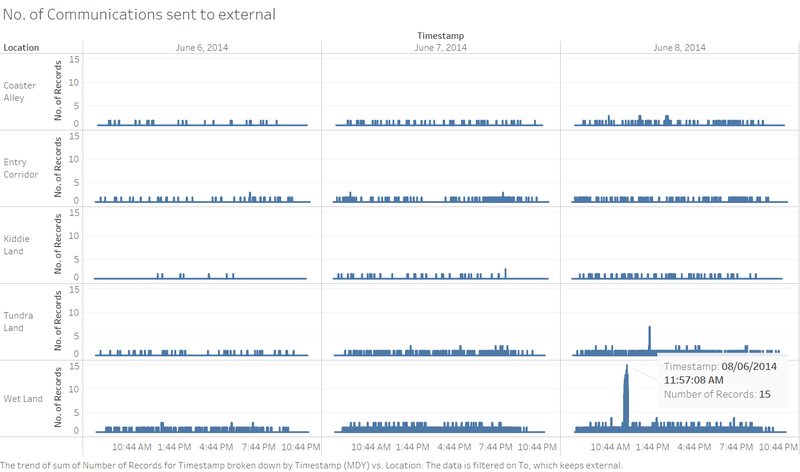
Observation 1: In the chart below, you can notice that there is a spike of communications to external parties on Sunday close to 12pm. This seems to be almost the same pattern observed with communications sent to ID 839736 at around 12pm as well. Could this indicate something of interest to the park visitors (like..vandalism?) that they can't help but share with their family and friends?
Network graph observations when a spike of messages was sent on Sunday 8 June at Lunchtime
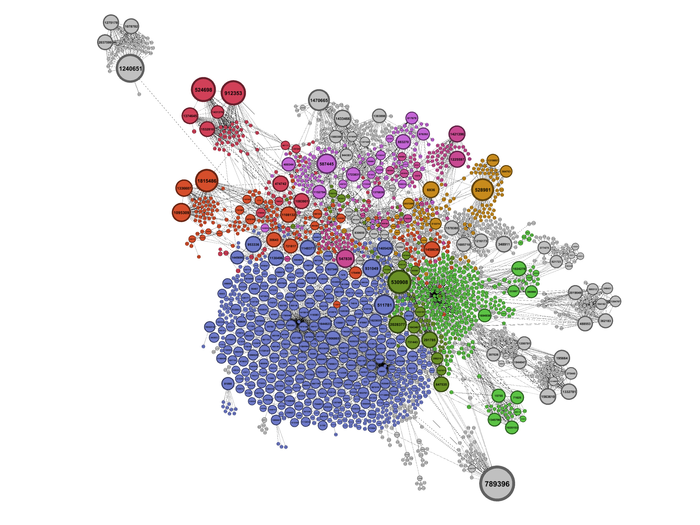
From the previous observations, the time period of 11.57am till 12.03pm on Sunday reveals a spike of messages sent to external and ID 839736. Furthermore, the spike appeared in the Wet Land area of the park. A data extract was performed for the abovementioned time period and location to review the communications patterns during these few crucial minutes. In the network graph below, Force Atlas layout was used as it provides clearer visuals among other layouts such as Yifan Hu and Fruchterman Reingold. Modularity statistic was run to allow detect of communities in the data, and afterwards colours applied to the graph. Out-degree attribute was used to adjust the size of the nodes. There are a few observations we can see here:
- Observation 2: The largest community on the lower left (shaded blue) are park visitors who have sent messages to ID 839736, which in an earlier section we suggest that it is a park information service.
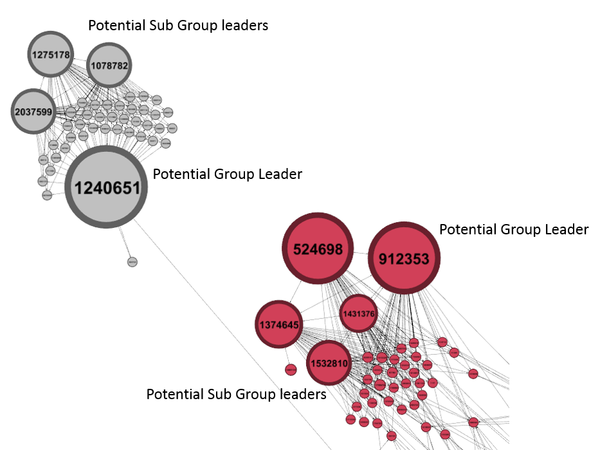
- Observation 3: Park visitors tend to travel in groups.Furthermore, there appears to be also not just group leaders but sub group leaders, especially for large groups like the ones below. This is because the sub group leaders appear to also take on the communications responsibilities to other group members, but on a lesser basis than the overall group leader.
