ISSS608 2016-17 T1 Assign3 Li Nanxun
Contents
Abstract
By leveraging the communication data and the movement data, several tourist patterns are found. But there is no apparent suspicious criminal pattern found, all the data shows that DinoFun World ran properly and reasonably.
Background
DinoFun World is a typical modest-sized amusement park, sitting on about 215 hectares and hosting thousands of visitors each day. It has a small town feel, but it is well known for its exciting rides and events.
One event last year was a weekend tribute to Scott Jones, internationally renowned football (“soccer,” in US terminology) star. Scott Jones is from a town nearby DinoFun World. He was a classic hometown hero, with thousands of fans who cheered his success as if he were a beloved family member. To celebrate his years of stardom in international play, DinoFun World declared “Scott Jones Weekend”, where Scott was scheduled to appear in two stage shows each on Friday, Saturday, and Sunday to talk about his life and career. In addition, a show of memorabilia related to his illustrious career would be displayed in the park’s Pavilion. However, the event did not go as planned. Scott’s weekend was marred by crime and mayhem perpetrated by a poor, misguided and disgruntled figure from Scott’s past.
While the crimes were rapidly solved, park officials and law enforcement figures are interested in understanding just what happened during that weekend to better prepare themselves for future events. They are interested in understanding how people move and communicate in the park, as well as how patterns changes and evolve over time, and what can be understood about motivations for changing patterns.
Tool Utilized
- Excel – to prepare data, and derive node properties (i.e. total number of different contacts)
- Tableau – to visualize the analysis.
- JMP – to prepare data, most for data cleaning, data join, data filtering.
- Gephi – to visualize the communication relationships.
Type of chart used: Bar Chart, Tableau Map, Gephi Degree.
Data Preparation
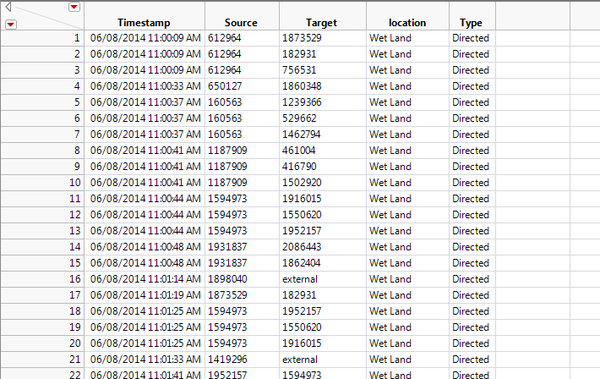
This part contains so many efforts, but I dont want to waste much time on the preparation because the methods is quite basic and normal. So I would like to briefly mention the way to generate my finaly worksheet and mainly talk about potential usage of my final data.
Data cleaning
After checking the columns one by one for each data sheet, I found several small problems in terms of data quality.
1. Missing value
2. Wrong map X and Y
3. Wrong ID
Due to the problems are really easy to solve, I just simply deleted the rows with confusing data.
ID Summary
In order to get the properties for each ID ( i.e. how many movement records did each ID do? how many different ID did each ID contact with?). There are several new columns derived from data sheets and joint together to get the ID properties. They are
1. N of From – number of total Out-contact (the tourist sent message out to other IDs).
2. N of To – number of total In-contact.
3. Check-in - check-in numbers, which can show how did the tourist participated in the park facilities.
4. Movement – record number of movement. According to my observation, the movement tracker records once the tourist moves 1 no matter in X axis or Y axis in the map, which means the record number can represent how far did the tourist move.
5. External – external communication record number.
6. Coaster Alley – Out-contact record number in Coaster Alley.
7. Entry Corridor – Out-contact record number in Entry Corridor.
8. Kiddie Land – Out-contact record number in Kiddie Land.
9. Tundera Land – Out-contact record number in Tundera Land.
10. Wet Land – Out-contact record number in Wet Land.
11. FromCommN – the number of IDs that the tourist had sent messages to.
12. FromAverageComm – the average Out-contact message volume.
13. ToCommN - the number of IDs that the tourist had received messages from.
14. ToAvgComm - the average In-contact message volume.
I generated all these columns mainly via Tabulate and Join functions in JMP.

Data Analysis
Problem 1
 1.	Identify those IDs that stand out for their large volumes of communication. For each of these IDs
 2.	Characterize the communication patterns you see.
 3.	Based on these patterns, what do you hypothesize about these IDs? Note: Please limit your response to no more than 4 images and 300 words.
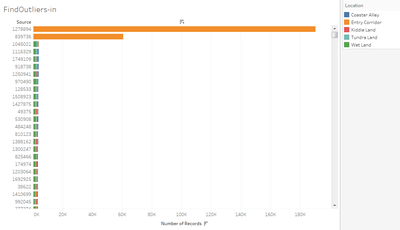
According to the “N of From” and “N of To”, which means the communication volumes, we can easily distinguish the two IDs with extraordinary communication volumes. They are 1278894 and 839736.
By checking the message position constitution, we can find that both the two IDs sent messages only at the Entry Corridor, while receiving messages sent by other tourists from all places of the funworld.
When we look closer to the raw data pattern in terms of timeline, we can find that ID1278894 shows very strong time serial pattern: only sent out messages based on a settled timeline with normally 5 min interval. And each time, the ID sent messages to relatively the same scale of people. Besides, both the two IDs don't have movement data, so ID1278894 should not be a tourist but park service, focusing on park notification pushing, park-wide activity organizing, so on and so far. Tourist can reply to the ID to participate activities like lucky lotto, guess guess guess, treasure hunting, etc.
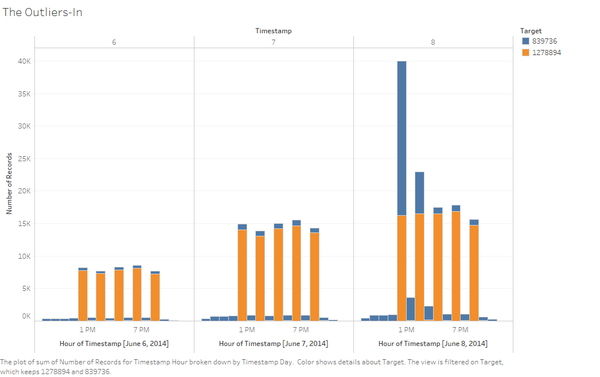
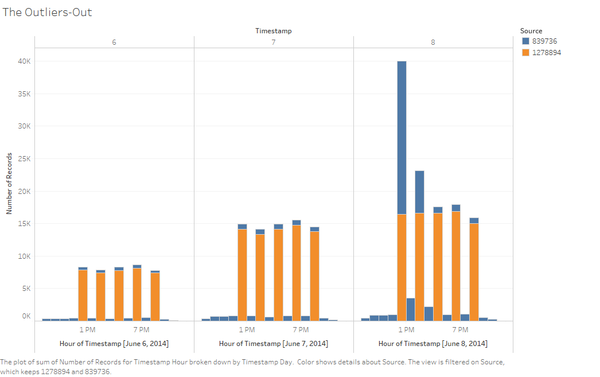
For 839736, the time pattern is not time series but skyrocked up at a moment (6/8 around 11 am. This is very strange, and should be when the crime should happen) while other times the communication volume for this ID is much less than that. Since no movement records, only sending at Entry Corridor and standing out among the IDs’ communication volumes, the ID should be a park service ID too. However, this ID should focus on park information queries and tourist help. Tourist sent messages to ID to complain and to get help.
Problem 2
Describe up to 10 communications patterns in the data. Characterize who is communicating, with whom, when and where. If you have more than 10 patterns to report, please prioritize those patterns that are most likely to relate to the crime. Note: Please limit your response to no more than 10 images and 1000 words.
Pattern 1.
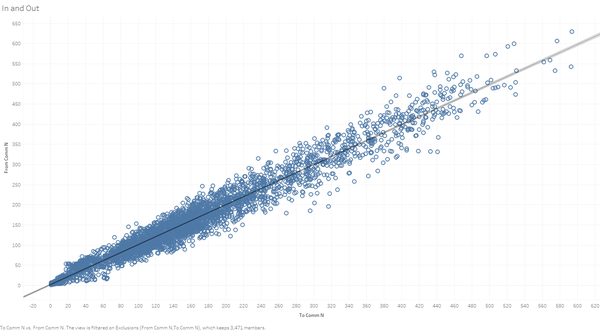
FromCommN and ToCommN have strong linear relationship and that is FromCommN ≈ ToCommN. This shows that tourists willing to reply to who sent messages to them.
Pattern 2.
FromCommAvg and ToCommAvg have the similar pattern, and most of the tourists made less than 40 in-messages and less than 40 out-messages on average to each of the ID they have communicated.
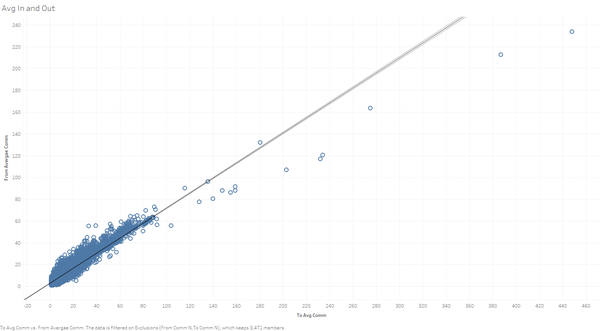
Pattern 3.
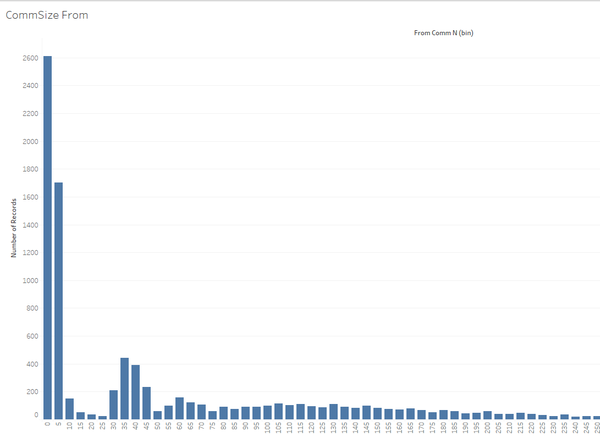
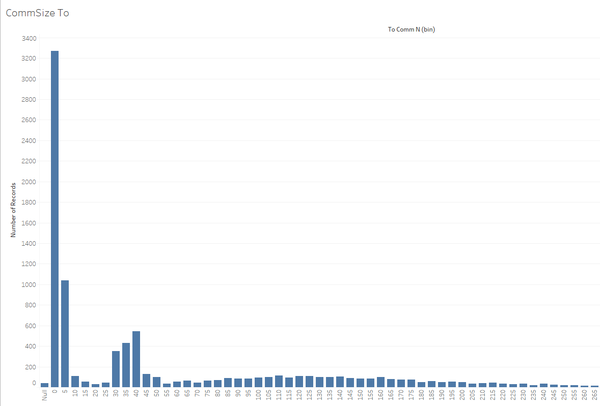
Most of the tourist group sizes is less than 10, while there are quite a few group senders. The common size of the group is about 30 to 50. This is generated based on the communication network size of these tourists
Pattern 4.
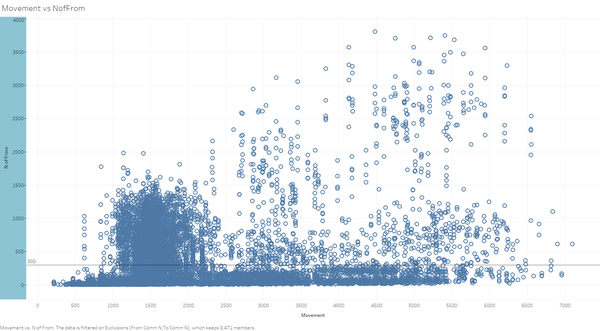
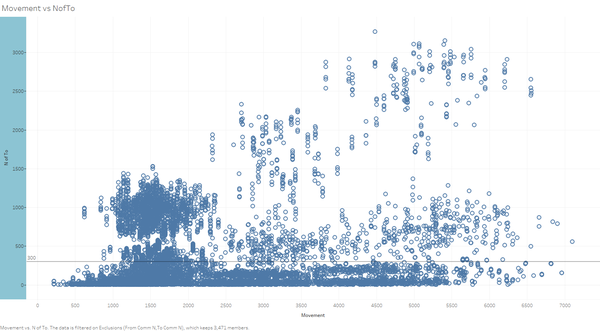
When add movement into consideration, interesting finding is that about one-third of the tourists have less than 2.5k steps of movement and their communication volume is less than 1500 rows (1500 out, 1500 in).
Pattern 5.
We can find there seems a separate layer that for those whose movement is more than 2.5k, there is a separate layer around N of From =300 (the same to N of To), about two-third of them are lower than the line. However, for those whose movement is less than 2.5, the friction goes to a half. So which means the percentage of the people who enjoy sending in-app messages is actually higher in low movement tourists than high movement tourists. Based on our common understanding, this is strange, since more movement means stay longer in the park, and more opportunities to communicated with in the app. Potential explanation may be related to the tourist app usage habit and type of people. Maybe those people who enjoyed texting like students have less motivation to purchase two-day or three-day pass, so they text more but move little.
Pattern 6.
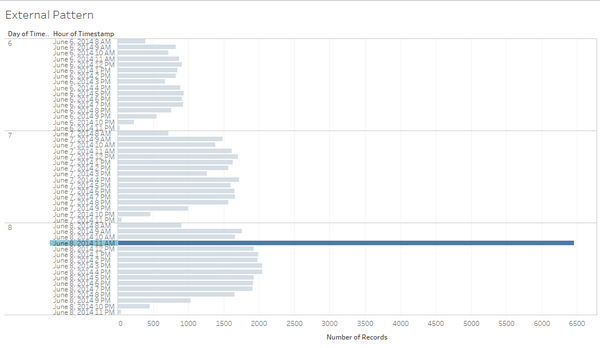
(Problem 3)During the period of 11 am to 12 am on 8th June, there is a dramatic increase in external communication. This may because the crime happened, tourists wanted outside to know the accident and rearrange their weekend plans.
Pattern 7.
(Problem 3) There is a very strange skyrocket of the communication volume of ID 839736, which should be a park information help desk as we have discussed.
Pattern 8.
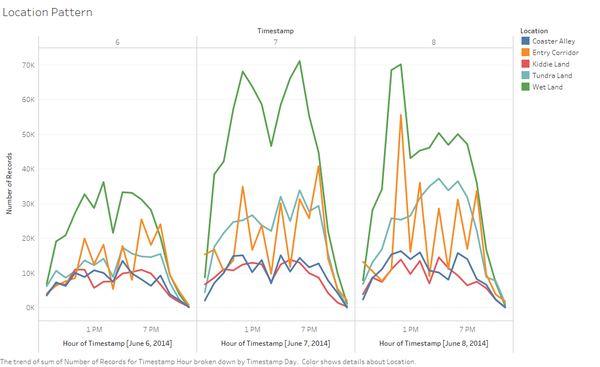
(Problem 3)When we plot the communication records in a time series with figuring out the message source, we can find that for the first two days, in Wet Land there are always two communication peaks, and no apparent peak for messages from the Entry Corridor which were mainly sent by the two park IDs. But we can notice that there is only one peak in 8th June and the afternoon one is gone, while there is an apparent peak of Entry Corridor shows up, which is consistent with our findings in Pattern 7.
The Node and Edge file
The goal to do Gephi data visualization is to try to find out the communication pattern within a short period so that we can identify the criminal group or suspicious parties.
Because of the large data size, I only focused on the IDs with particular features in order to reduce the data size to hundred-of-node level so that make the visualization meaningful. Based on my analysis which will be mentioned below, the selection conditions are:
1. Timestamp: 6/8 11am to 6/8 1pm, which was the time that the crime showed up and the communication data shows unusual patterns.
2. FromCommN: 4~8. Because this is the total number of communicated IDs of one tourist, which may include external, 1278894 and 839736, either too small or too large can be against normal criminal group size (criminals should not be willing to talk to many people, they should stay to a relatively small group. Due to some park service ID and other group senders, the potential FromCommN should be slightly higher, so that’s why I choose 4 as the lowest limitation.)
3. Wet Land only. This is because based on the ground truth and my own findings, the crime happened at the Wet Land, so in order to shrink the data size, I only focused on communication records from Wet land.
4. Check-in: less than 30. Since the suspicious parties may spend more time on planning the crime, their check-in times should be lower than normal tourist.
And for the node file, I choose to use the ID summary as one of the joint table, which don't have ID 1278894 and 839736 because they don't have movement data.
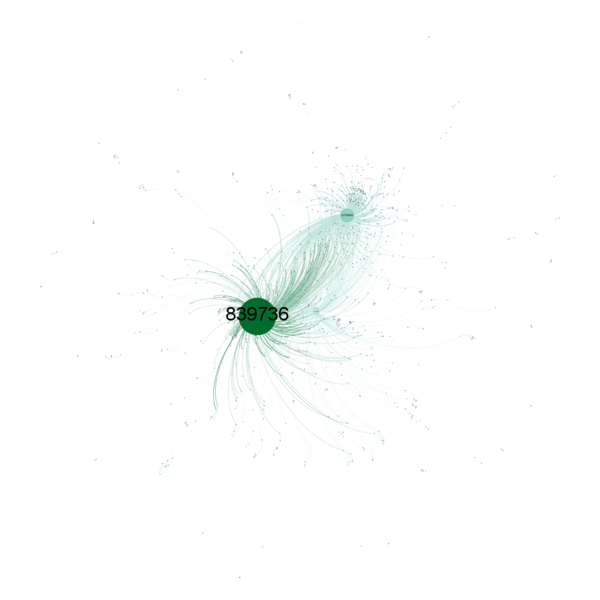
In-Degree - With missing nodes created. Since the missing nodes are created, some no-tourist ID and other tourist IDs which has no From record but in records during this particular time show up.
As we can see, there are three very apparent nodes: 839736: which is the biggest node. But we should notice that, 839736 is always the message receiver in this data. So, we can get a very clear fact that tourists communicated with the park a lot during this period, so it must be related with the crime and the reaction of the park (I.e. cancel the following shows, inform the tourists in the park of the issue and following decisions.) 1278894: which is the second big node. This should because of the functions of this ID ( as we have talked about, the ID should be park notification pusher and park-wide activity organizer.) The third one is external.
Degree - Without missing nodes created.(Degree, In-Degree, Out-Degree is relatively the same) Without missing nodes created means the nodes are those who had sent out in-app messages during the period.
According to the Gephi graph, we cannot find edges, but several overlapped big nodes. That strange pattern means that all the big but overlapped circles means that tourists communicated a lot only with in their own groups, which make it every easy to group them and notice their relationship.
Problem 3
According to what I have mentioned, the Pattern 6,7 and 8 already answered that question.
Conclusion
Recommendation
If the DinoFun World really want to leverage the data to get some business insights, it can actually improve the communication location data to exact x and y, inside of a big part of the park.
There is one thing to noticed that there are quit a few tourists (1947) totally havent the in-app communication. Which should pay attention to because say I am a potential criminal, I wont use it because I wont leave any useful imformation which may leak my plan and make me in risk to be caught by the police. So DinoFun World should try some way to improve the acceptance of its app to let tourists use it and enjoy it at least during their tour in DinoFun World instead of being ignored and replaced by other common social network app like WhatsApp and Facebook Messanger.
Future Work
In fact, my work is not well connected with the movement data. There are places to improve.
- link the movement data and the communication data and we can get the exact location of the caller, but this one needs join the 20 million rows of data with 4 million rows of data, which is totally not capable for my laptop, so I had to give up.
- I didnot spend time on checking the group movements because of my laptop's configuration limitation.
