ISSS608 2016-17 T1 Assign3 Lee Gwo Mey
Contents
Abstract
- The purpose of this assignment is to explore and apply different visual analytics tools and techniques to analyze the available data and provide responses to the 3 tasks given
- Summary of my responses to the 3 tasks are
Task 1: IDs with Large Volume of Communication
- There are 3 IDs with exceptionally high volume of communication compared to the rest.
- ID_1278894 sent out messages at regular interval during the day and this ID could be used to administer the DinoFun World Apps and for visitors to play the Cindysaurus Trivia Game.
- ID_839736, though record a high volume of communication, there is no fixed communication pattern observed apart from a huge spike in volume at 12hrs on Sunday.
- ID_External is a common ID used to record communication between park visitor to an external party.
Task 2: Communication Patterns
Background of Case
DinoFun World is a typical modest-sized amusement park, sitting on about 215 hectares and hosting thousands of visitors each day. It has a small town feel, but it is well known for its exciting rides and events.
One event last year was a weekend tribute to Scott Jones, internationally renowned football ("soccer" in US terminology) star. Scott Jones is from a town nearby DinoFun World. He was a classic hometown hero, with thousands of fans who cheered his success as if he was a beloved family member. To celebrate his years of stardom in international play, DinoFun World declared "Scott Jones Weekend", where Scott was scheduled to appear in two stage shows each on Friday, Saturday and Sunday to talk about his life and career. In addition, a show of memorabilia related to his illustrious career would be displayed in the park's Pavilion. However, the event did not go as planned. Scott's weekend was marred by crime and mayhem perpetrated by a poor, misguided and disgruntled figure from Scott's past.
While the crimes were rapidly solved, park officials and law enforcement figures are interested in understanding just what happened during that weekend to better prepared themselves for future events. They are interested in understanding how people move and communicate in the park, as well as how patterns changes and evolve over time, and what can be understood about motivations for changing patterns.
The Tasks
Task 1 (Not More than 4 images and 300 words)
Identify those IDs that stand out for their large volume of communication. For each of these IDs,
- Characterize the communication patterns you see
- Based on these patterns, what do you hypothesize about these IDs?
Task 2 (Not More than 10 images and 1000 words)
Describe up to 10 communication patterns in the data. Characterize who is communicating, with whom, when and where. If you have more than 10 patterns to report, please prioritize those patterns that are most likely to relate to the crime.
Task 3 (Not More than 3 images and 300 words)
From this data, can you hypothesize when the vandalism was discovered? Describe your rationale.
Data Sets
- DinoFunWorld_CommData.zip (3 days' in-app communication data)
- DinoFunWorld_MoveData.zip (3 days' park movement data)
- DinoFunWorld_LayoutMap.zip
- DinoFunWorld_Website.zip (webpages of DinoFun World Park)
The communication data includes communications between the paying park visitors, as well as communications between the visitors and park services. In addition, the data also contains records indicating if and when the user sent a text to an external party.
Brief description of the Communication data fields are
- Timestamp: date (yyyy-mm-dd) and time (hh:mm:ss AM/PM) of communication. Eg. 2014-06-06 08:03:19AM
- From: identifier number that send out the communication message. Eg. ID_439105
- To: identifier number that receive the communication message. Eg. ID_1053224
- Location: location name where the communication message was sent/received. Eg. Kiddie Land
Visualization Software Used
- JMP Pro 12
- Tableau 10.0
- Gephi 0.9.1
Exploratory Visualization Approach
- Overview first, Zoom and Filter; then details-on-demand[1]
- Network Visualization and Analysis Process Model[2]
Responses to Tasks
Task 1: IDs with Large Volume of Communication
Overview of IDs Communication Volume
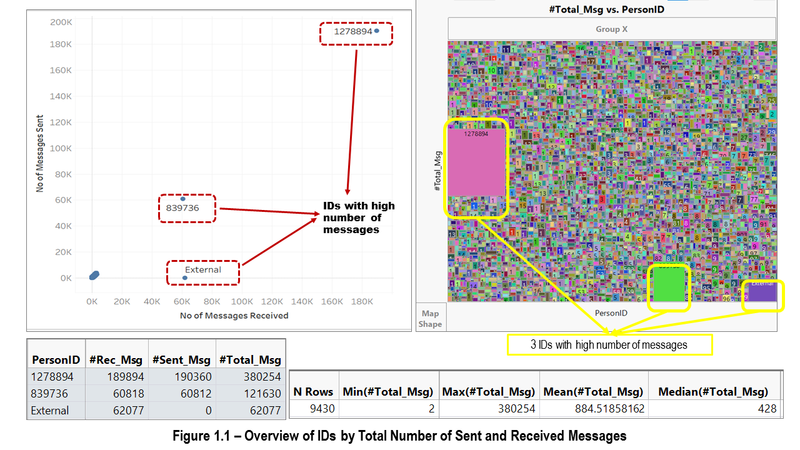
- Figure 1.1 shows an overview of the total number of messages sent and/or received by each ID
- The median number of messages per ID is 428
- The 3 IDs with exceptionally high number of messages compared to the rest are ID_1278894, ID_839736, and ID_External
Communication Patterns of ID_1278894
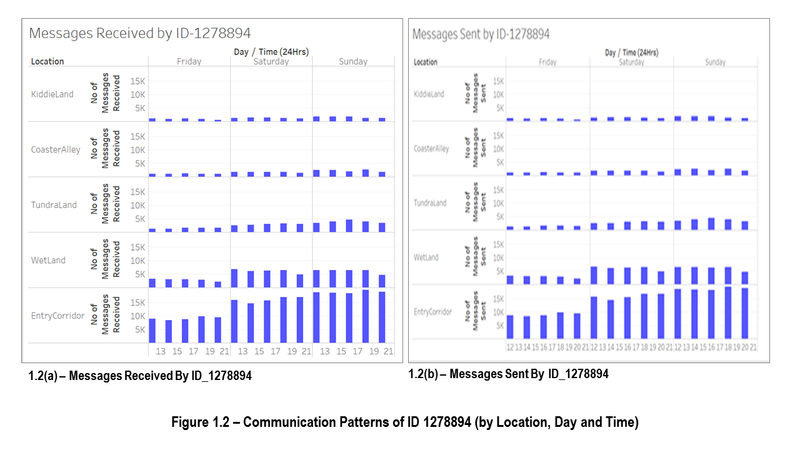
- Figure 1.2 shows the communication patterns of ID_1278894 at different locations for all 3 days and at different time
- The patterns revealed that messages were sent or received at hourly intervals in the afternoon (at 12hrs, 14hrs, 16hrs, 18hrs and 20hrs)
- Tracing this ID_1278894 to the movement data, I found no records
- As there is no physical movement records for ID_1278894, it is unlikely for this ID to be assigned to a phone or park device carried by the park visitor or park staff
- Majority of the messages were concentrated at the Entry Corridor. It is possible that this ID is used to send messages (eg. Welcome messages) to park visitors when they first enter the park, and for park visitors to register with the park's DinoFun World App
- Based on the communication patterns, ID_1278894 could be used to administer the Cindysaurus Trivia Game application
Communication Patterns of ID_839736
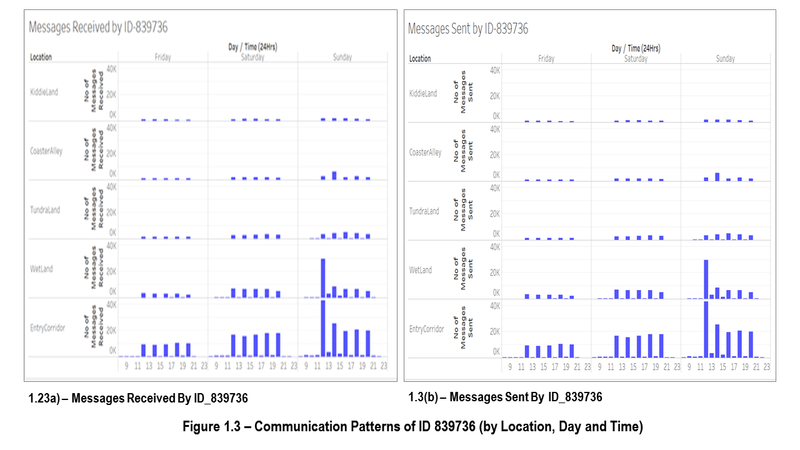
- Figure 1.3 shows the communication patterns of ID_839736 at different locations for all 3 days and at different time
- Messages were sent and/or received throughout the day and at any time
- There is no noticeable pattern except for a huge spike at 12hrs on Sunday. This is likely related to the time of vandalism.
- Tracing this ID_839736 to the movement data, I found no records
- As there is no physical movement records for ID_839736, it is unlikely for this ID to be assigned to a phone or park device carried by the park visitor or park staff
- Based on the communication patterns, ID_839736 could be used as DinoFun Hotline or Helpdesk
Task 2: Communication Patterns
Overview of Communication Patterns at Locations with Scott Jones' Activities
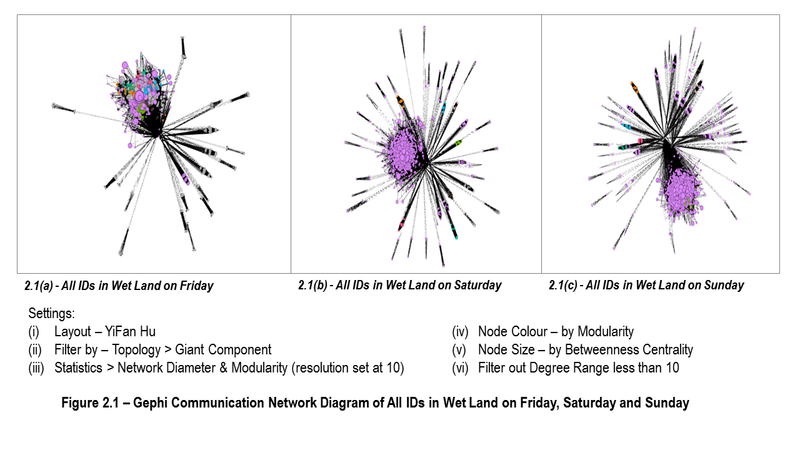
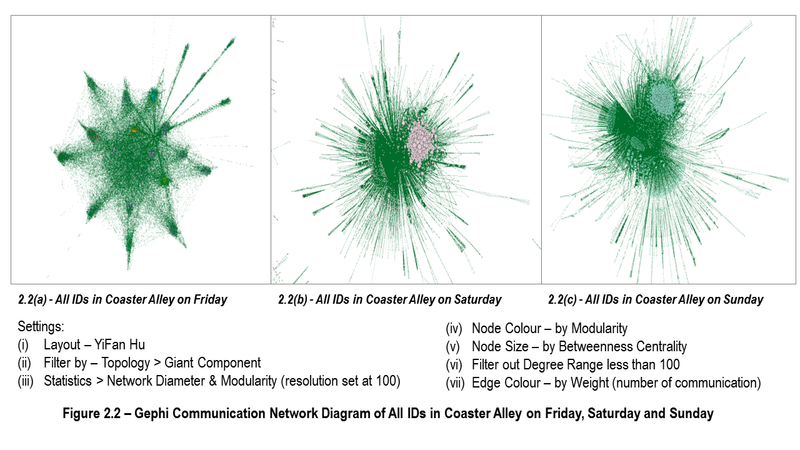
- Figure 2.1 and 2.2 shows the communication networks of all IDs at Wet Land and Coaster Alley for all 3 days (Friday, Saturday and Sunday)
- Location Wet Land and Coaster Alley were selected for analysis as Scott Jones' activities were concentrated at these 2 locations
- Display of Scott's memorabilia is at Attraction 32 Creighton Pavilion located in Wet Land
- Scott Jones' appearance at stage show is at Attraction 63 Grinosaurus Stage located in Coaster Alley
- No meaningful patterns can be observed from Figure 2.1 and Figure 2.2, due to the large number of IDs
- Next, I will attempt to explore by selecting the next 3 IDs with high communication volume
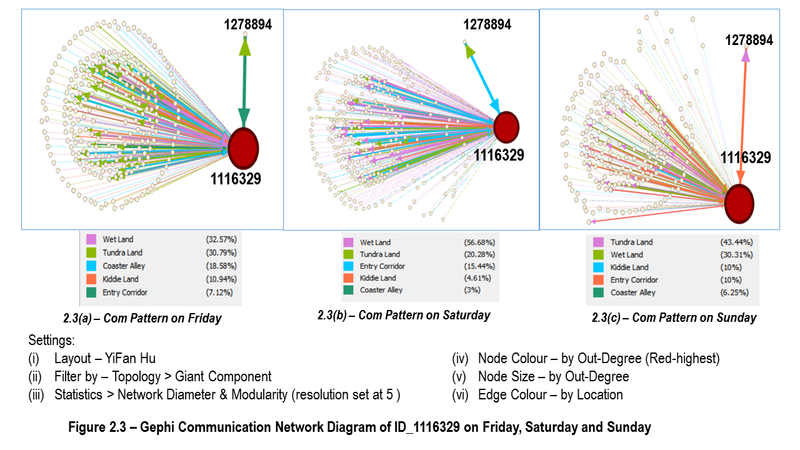
Communication Pattern of ID_1116329
- ID_1116329 sent out high number of messages to large group of people for all 3 days
- ID_1116329 also communicate most frequently with ID_1278894 (DinoFun World App Service)
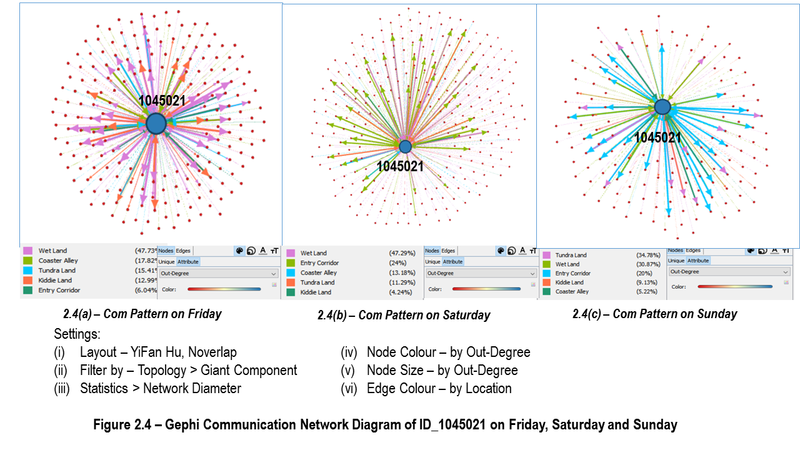
Communication Pattern of ID_1045021
- ID_1045021 sent out high number of messages to large group of people for all 3 days
- Location of people who received the messages are in Wet Land on Friday and Saturday, and in Tundra Land on Sunday
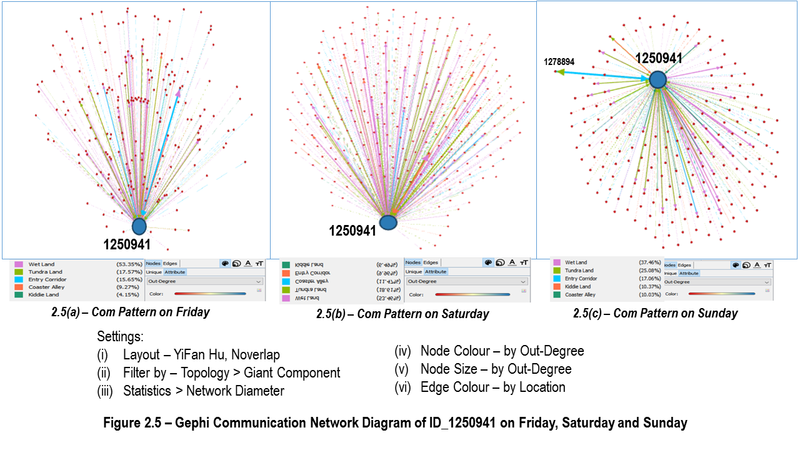
Communication Pattern of ID_1250941
- ID_1250941 sent out high number of messages to large group of people for all 3 days
- On Sunday, more messages were made between ID_1250941 and ID_1278894, likely due to the discovery of vandalism on that day
Changes in Communication Pattern on Friday, Saturday and Sunday
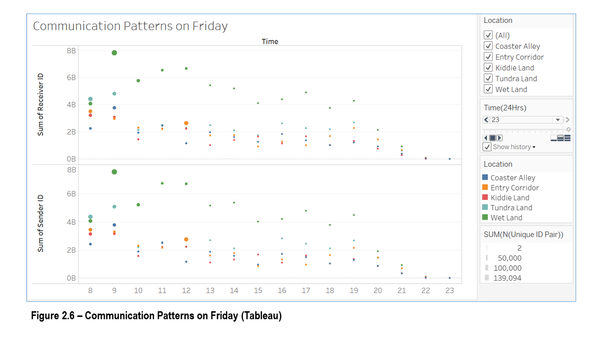
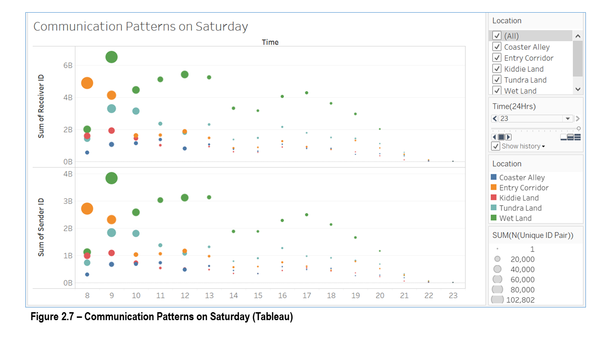
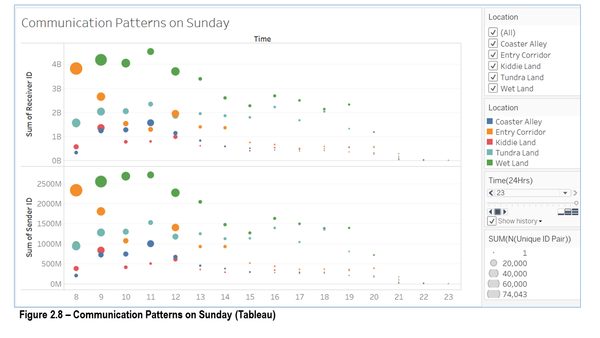
- Figure 2.6 to Figure 2.8 shows the changes in communication patterns at different locations on Friday, Saturday and Sunday
- Communications at the Entry Corridor and Wet Land areas were the highest at 9am
- Possible reason could be the display of Scott's memorabilia at Wet Land (Creighton Pavilion) was first opened to visitors on Friday
- On Sunday, communications at Wet Land area remained high in the morning before tapering down in the afternoon
Task 3:When the Vandalism was Discovered?
Spike in Communication Volume on Sunday
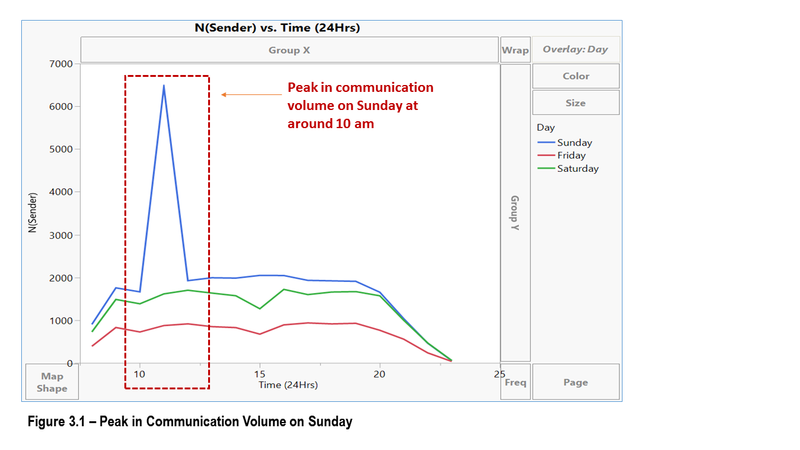
- Figure 3.1 shows that there was a spike in communication volume on Sunday
- It is likely that the vandalism was discovered on Sunday, leading to an increase in communication activities
- Next, I will zoom down to the possible timeframe when the discovery was made
Visitors Check-in Patterns at Creighton Pavilion
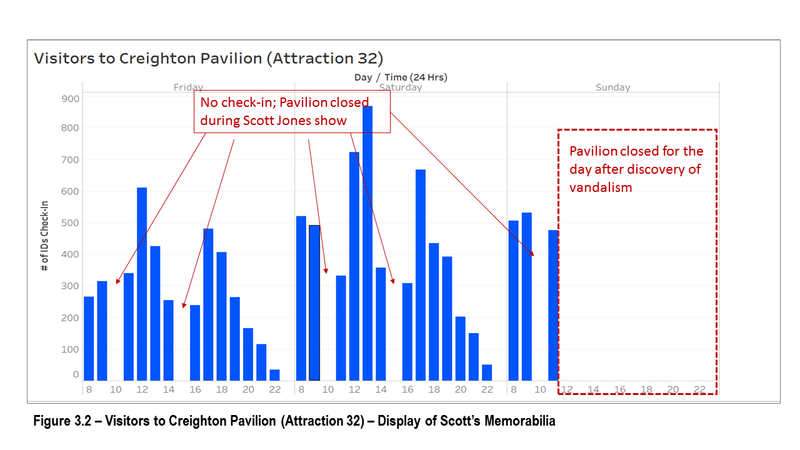
- Figure 3.2 shows the visitors check-in patterns at Creighton Pavilion, the place of vandalism
- From the check-in patterns, there were no check-in at around 9am to 11am and 2pm to 3pm.
- I inferred that the Pavilion was closed during the time when Scott Jones was at the show in Grinosaurus Stage
- Figure 3.2 also showed that there was no check-in on Sunday after 12 noon
- It is likely that the vandalism was discovered and the crime scene was closed for investigation
- Next, I will drill down to the actual timeframe on Sunday afternoon to determine the time of discovery
Timing of Spike in Messages Sent to External
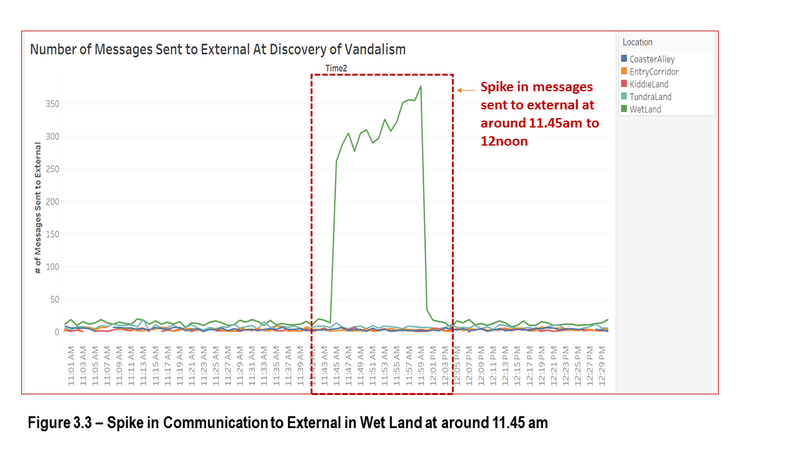
- Figure 3.3 shows that there was a spike in messages sent to external at around 11.45am
- The communication pattern to external was analysed as I made the assumption that visitors who were there at the vandalism scene were likely to shared their first-hand discovery with friends who were not with them at the park
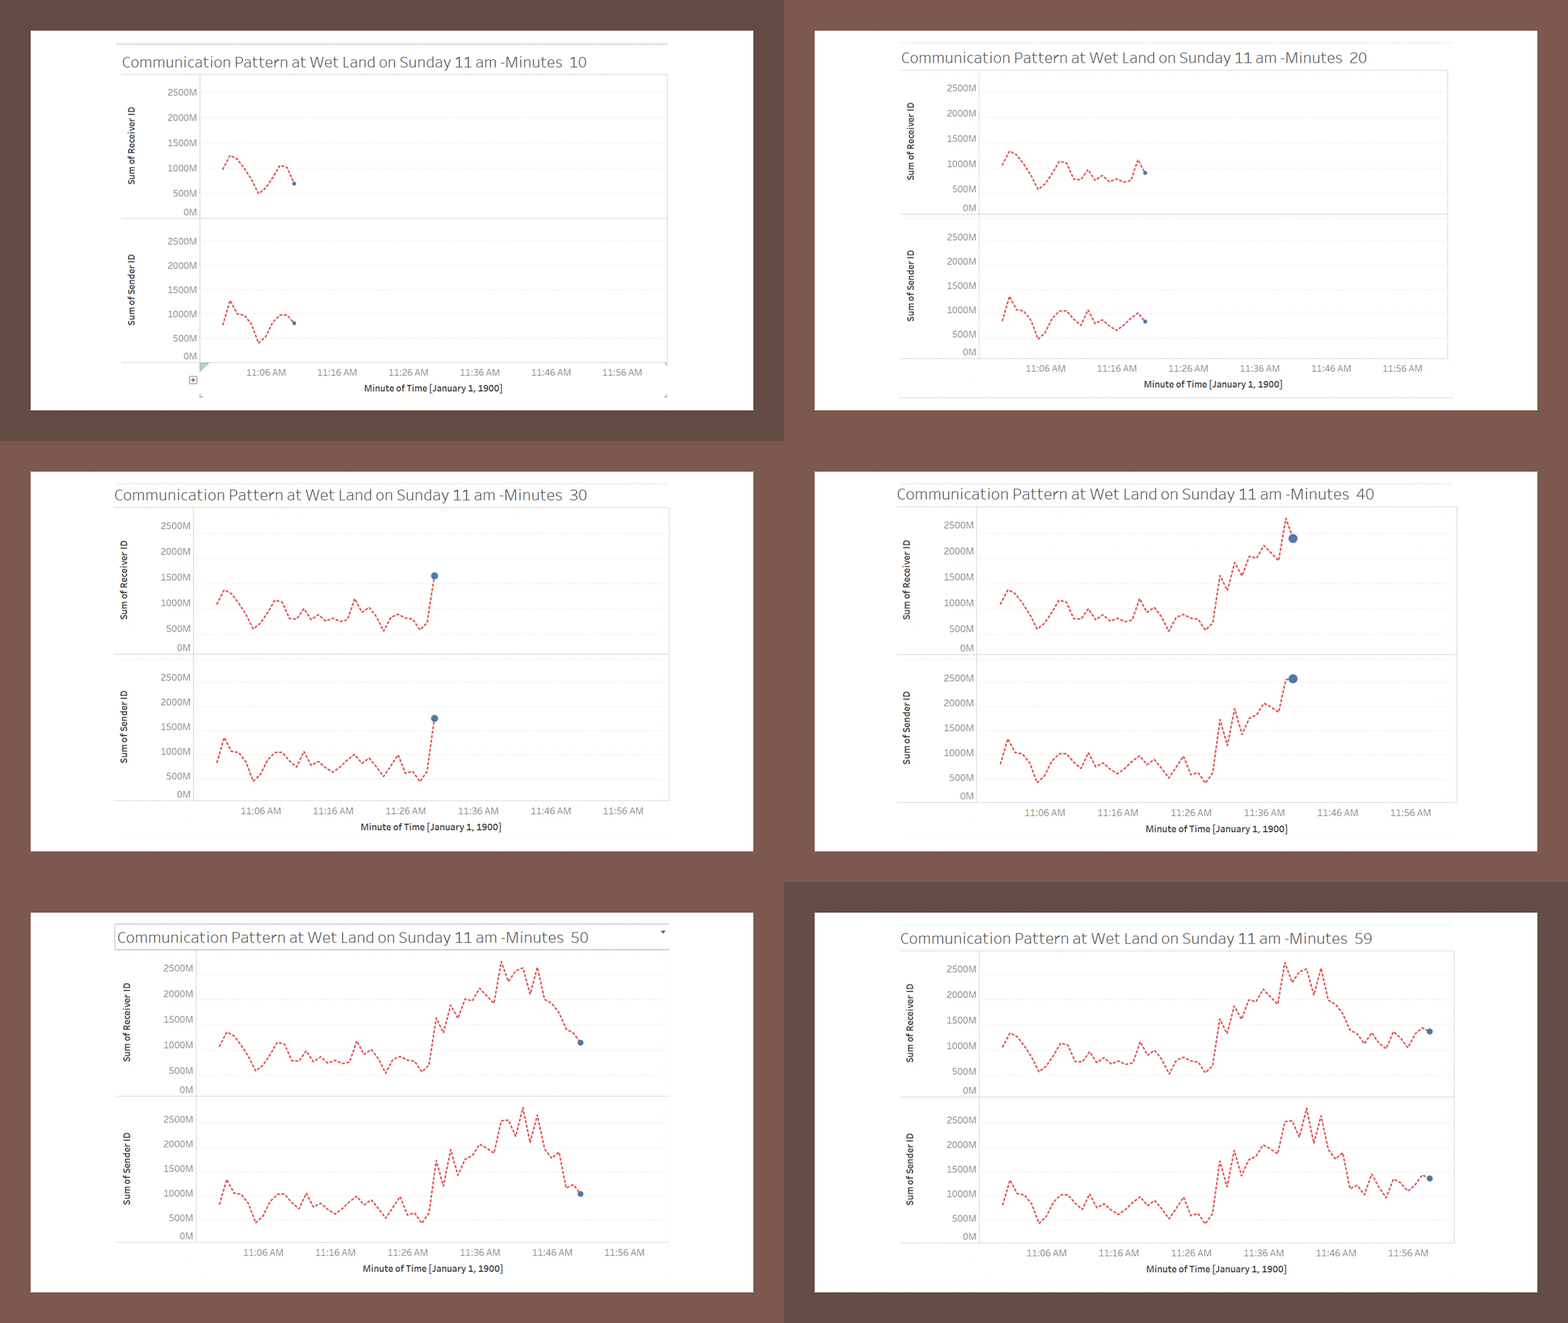
- Based on Figure 3.3, I deduced that the discovery was made around 11.30am by the first group of visitors to the Pavilion when it re-opened for operation.
References
[1] Visual Information-Seeking Mantra [Shneiderman,1996]
[2] Network Visualization and Analysis Process Model [Hansen, D. L. et. al. 2009]
[3] YouTube Gephi Tutorials [1]
[4] Visual Analytics Benchmark Repository [2]
