ISSS608 2016-17 T1 Assign3 Ye Jiatao
Overview
DinoFun World is a typical modest-sized amusement park, sitting on about 215 hectares and hosting thousands of visitors each day. It has a small town feel, but it is well known for its exciting rides and events. One event last year was a weekend tribute to Scott Jones, internationally renowned football (“soccer,” in US terminology) star. Scott Jones is from a town nearby DinoFun World. He was a classic hometown hero, with thousands of fans who cheered his success as if he were a beloved family member. To celebrate his years of stardom in international play, DinoFun World declared “Scott Jones Weekend”, where Scott was scheduled to appear in two stage shows each on Friday, Saturday, and Sunday to talk about his life and career. In addition, a show of memorabilia related to his illustrious career would be displayed in the park’s Pavilion. However, the event did not go as planned. Scott’s weekend was marred by crime and mayhem perpetrated by a poor, misguided and disgruntled figure from Scott’s past. While the crimes were rapidly solved, park officials and law enforcement figures are interested in understanding just what happened during that weekend to better prepare themselves for future events. They are interested in understanding how people move and communicate in the park, as well as how patterns changes and evolve over time, and what can be understood about motivations for changing patterns.
The Task
In this case, we mainly need to solve the following question using the in-app communication and visitor movement data:
- Identify those IDs that stand out for their large volumes of communication. For each of these IDs
- Characterize the communication patterns you see.
- Based on these patterns, what do you hypothesize about these IDs? Note: Please limit your response to no more than 4 images and 300 words.
- Describe up to 10 communications patterns in the data. Characterize who is communicating, with whom, when and where. If you have more than 10 patterns to report, please prioritize those patterns that are most likely to relate to the crime. Note: Please limit your response to no more than 10 images and 1000 words.
- From this data, can you hypothesize when the vandalism was discovered? Describe your rationale. Note: Please limit your response to no more than 3 images and 300 words.
Data Set
- DinoFunWorld_CommData.zip consist of in-app communication data over the three days of the Scott Jones celebration.
- DinoFunWorld_MoveData.zip consists of three days park movement data. The park movement datasets are in csv format.
- DinoFunWorld_LayoutMap.zip consists of a jpg file.
- DinoFunWorld_Website.zip consists of webpages of DinoFun World Park.
Approaches
Q1
Identify those IDs that stand out for their large volumes of communication. For each of these IDs
- Characterize the communication patterns you see.
- Based on these patterns, what do you hypothesize about these IDs?
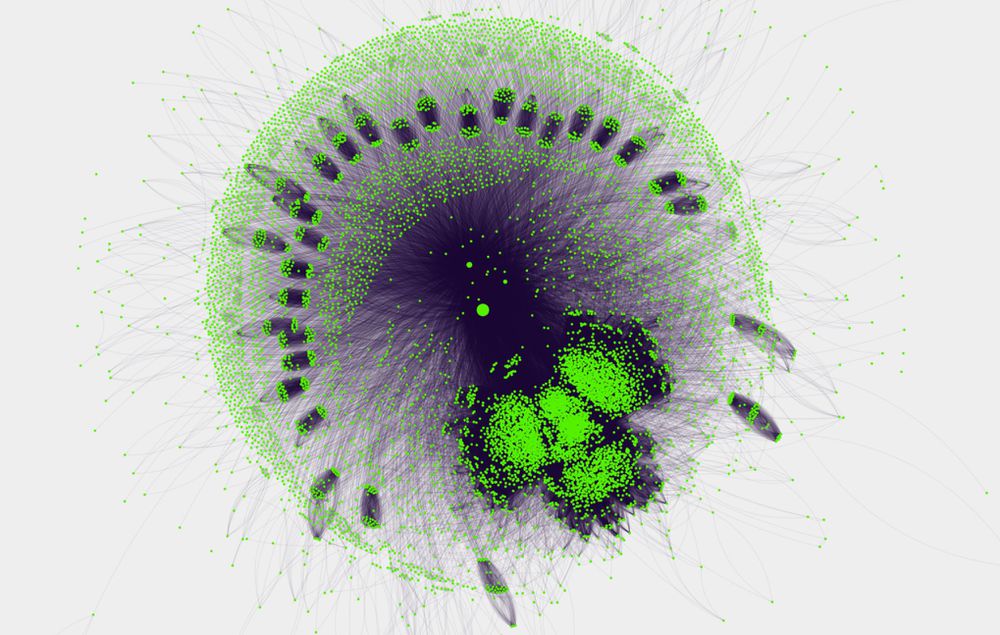
From the network figure above, 3 IDs stand our for their large volume of communication: 1278894, 839736 and external. Because external means sending messages outside the park, in this step, we just focus on ID 1278894 and 839736.
- ID 1278894
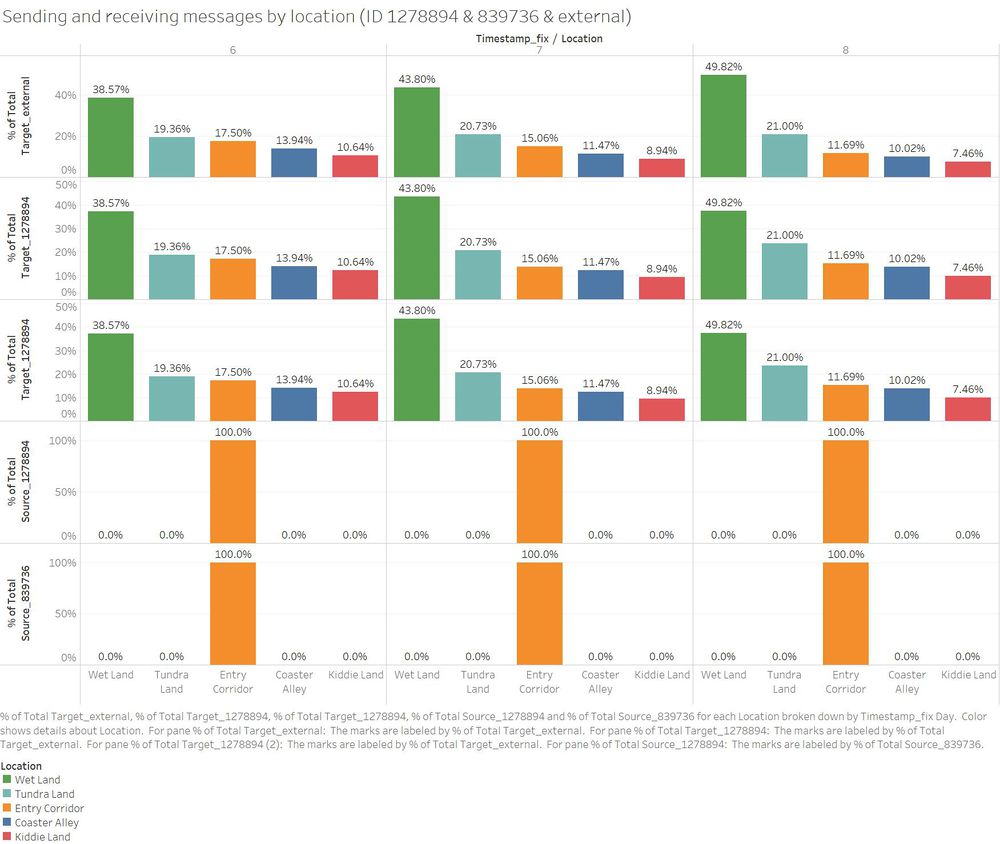
- There is no connection among ID 1278894, 839736 and external, namely, these 3 account haven't send or receive message from each other.
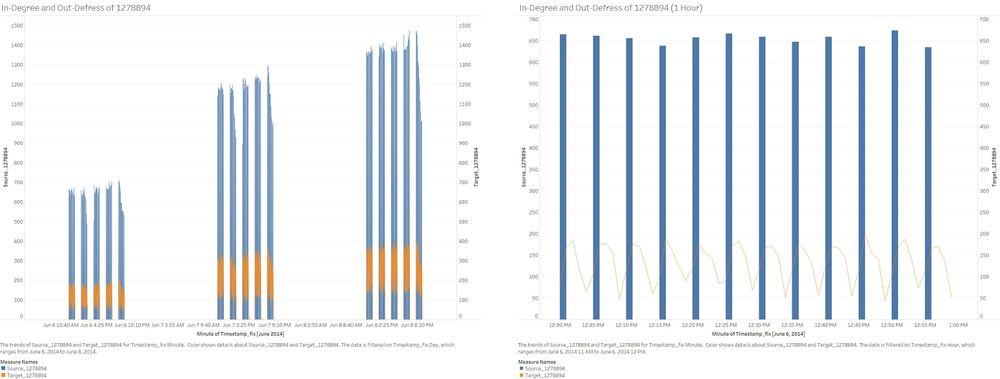
- There is a clearly cyclical messaging pattern for ID 1278894 within these 3 days. From 12:00 each day, this ID begin to send out a large number of messages in every 5 minutes in an hour, wait for another hour and repeat 5 minutes messaging again within next hour.
- The cyclical communication pattern would repeat 5 times a day, which begins from 12:00 to 20:00 in the evening.
- The communication volume keeps increase steadily from Friday to Sunday, which means there are more and more people come to visit this park within this period.
- This ID only have record of sending messages from Entry Corridor.
By now, we can hypothesize that ID 1278894 is a account for park employee who always on the entry. Because the amount of message sent out by this account remain relatively steady with a day, we can assume that this ID sends out messages to all visitor in the park related to attraction open info or cindysaurus trivia game mentioned in the park's official website.
- ID 839736
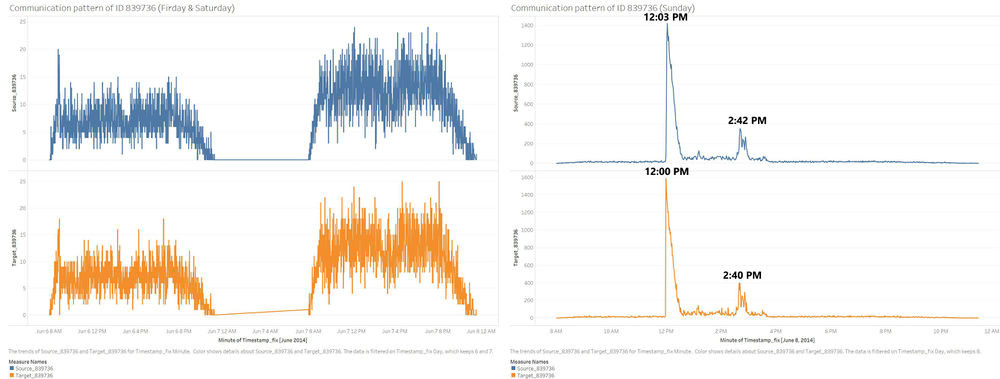
- The messaging pattern of ID 839736 is not as clear as that of ID 1278894. It sent and received up to 25 messages per minutes from 8:00 am to 11:30 pm each day except for Sunday, when there is abnormal peak of communication showed up, which reached around 1400 messages in 1 minutes for receiving at 12:00 and sending at 12:03.
- The sending and receiving pattern is time correlative for this ID, which means that it will respond to the inquiry or questions manually.
- This ID also only have records in Entry Corridor.
From the evidences above, we can confidently hypothesize that this ID is another park employee who in charge of emergency events and responding to visitors' inquiry. It seems there is something emergency happened at 12:00 pm on Sunday, which cause of the abnormal peak of communication in terms of this ID.
Q2
Q2: Describe up to 10 communications patterns in the data. Characterize who is communicating, with whom, when and where. If you have more than 10 patterns to report, please prioritize those patterns that are most likely to relate to the crime.
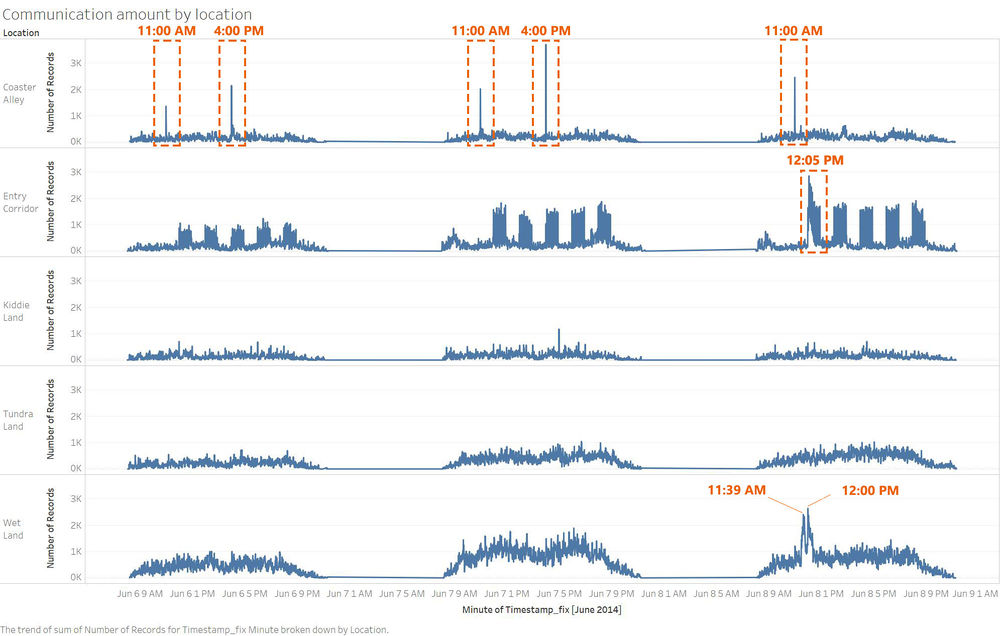
- Pattern 1: There are 2 sending messages peaks appeared in Coaster Alley at 11:00 am and 4:00 pm on Friday and Saturday, while there is only 1 peak showed up at 11:00 am on Sunday. From the park map, we can get that there are 2 stage in this area, namely, 32.Creighton Pavilion and 63.Grinosaurus Stage, which is the place Scott would show up. So far, we can guess that Scott's show was hold in Coaster Alley and the show time are around 11:00 am and 4:00 pm. The communication peak in this area may result from people talked about the shows they were watching or notified their friends the show was begin, or shared the photos of the show through app.
- Pattern 2: There supposed to be a communication peak around 4:00 pm in Coaster Alley on Sunday in normal condition. The missing peak indicate there are something happened between 11:00 am and 4:00 pm, which lead to the cancel of the last Scott's show, so we can infer that the crime timing is between 11:00 am to 4:00 pm. There is a high chance the chaos appeared in the middle of Scott's first show on Sunday.
- Pattern 3: There is a unusual peal showed up at 12:05 pm in Entry Corridor, which can be more visitors came into the park, but there is is higher potential these are visitors who leaved the park in advance because of vandalism. If my hypothesis is true, the crime timing can be further narrowed into 11:00 am to 12:05 pm.
- Pattern 4: There are 2 unusual communication peaks appeared at 11:39 am and 12:00 pm in Wet Land. From the map, we can get that the only way out from location 32 or 63 is Wet Land, so the unusual peak maybe the result of people leave the show in advance because of vandalism. By now, we can further shorten the time of incident into 11:00 am to 11:39 am.
