ISSS608 2016-17 T1 Assign3 CHIA Yong Jian
Revision as of 23:23, 27 October 2016 by Yongjian.2015 (talk | contribs) (→Data Review and Preparation)
Contents
What Happened?
Based on the case information, this is what can be gathered:
- What event was going on? Scott Jones, an international football star, was to celebrate his years of stardom and appear in two stage shows each from Friday to Sunday. His memorabilia was to be displayed at the park's pavilion
- What was the crime? - Vandalism was discovered.
- Who did the crime? - A "poor, misguided and disgruntled figure from Scott’s past". The identity of the person is not known, yet.
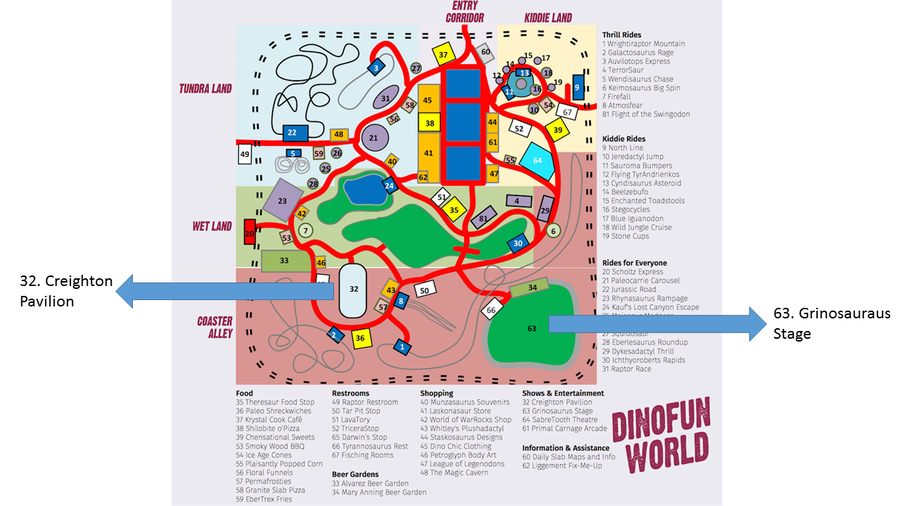
- Where is the location of crime: Within At DinoFun World. Since Scott Jones's weekend include two events, the crime either happened at where his stage show is or where he is showing his memorabilia at the pavilion. Since the crime was on vandalism, it is likely that his items on displayed were vandalised. However, we will look into the communications and movement data to confirm that this is happening.
The DinoFun World website provides the following additional details:
- The memorabillia exhibition is at the Creighton Pavilion (Entrance at Wet Land). No specific mention of where the stage show is at, although based on the park map, the park only have 1 location that is a stage - Grinosaurus Stage (Entrance at Coaster Alley).
- There is also a DinoFun World App that allows visitors to check-in at rides, SMS friends, which can be installed on the person's own phone or via devices borrowed from the park. In addition there is also a Cindysaurus trivia game embedded within the mobile application. It will be useful to examine the communications and movement data to observe patterns.
- Unfortunately, some information such as park opening and closing time is not available in the case information or on the DinoFun website.
Data Review and Preparation
SAS JMP Pro 12 was used to review and prepare data.
Communications Data
Three days worth of data (Friday, Saturday, Sunday) of the fateful weekend was provided, with each having between 948,739 to 1,655,866 records. Each file has the following columns:
| Column | Description | Remarks |
|---|---|---|
| Timestamp | in YYYY-MM-DD HH24:MM:SS format | - |
| from | unique identifier of the sender | All communications came from a unique identifier - no messages are sent by an "external" party |
| to | unique identifier number of the receiver | Receiver ID can be indicated as "external" as well - assuming external means to a party not in the park. |
| location | indicates where the message was sent from. | All messages came from one of the following areas in the park: Wet Land, Tundra Land, Kiddie Land, Entry Corridor, Coaster Alley |
No missing data was observed in the dataset.
For loading into Gephi later, the following columns will be renamed:
- "from" renamed to "Source"
- "to" renamed to "Target"
Movement Data
Movement data was also provided for the 3 days, with each having between 6 to 10 million records, and the following columns:
| Column | Description | Remarks |
|---|---|---|
| Timestamp | in YYYY-MM-DD HH24:MM:SS format | - |
| id | Unique identifier of the person making the movement | - |
| type | Either movement or check-in type | - |
| X | X-Coordinate of the location | Values are between 0-100 |
| Y | Y-Coordinate of the location | Values are between 0-100 |
The movement data, together with the park map, will be plotted using Tableau to visualise movement of the individuals in the park.
