ISSS608 2016-17 T1 Assign2 Nguyen Tien Duong
Objectives
The original project is entirely funded with 39,292.83 € (https://meta.wikimedia.org/wiki/Research:Wiki4HE) , which is not very luxurious to afford commercial statistic softwares such as SAS, JMP, Tableau… to analyze.
The aim of this project is to produce visual analytic platform cost effective using open source D3js to draw out findings that original research covered as well as findings outside of the primary research.
Analytical goals
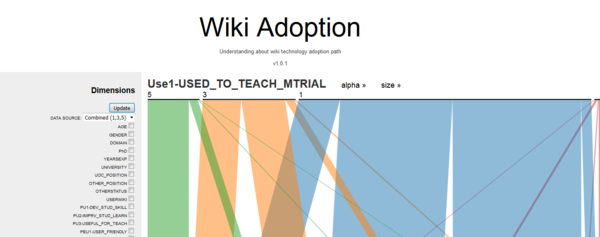
- Aimed to create Interactive Visualization using Parallel Sets to discover causation relationship between factors that influence Wiki Adoption process.
- To hand-on D3.js and get hand dirty.
Application URLs
Application
 Tag (milestone):
 https://rawgit.com/Zendom88/wiki_adoption/v1.0.1/index.html
 Dev master (updating on fly):
 https://rawgit.com/Zendom88/wiki_adoption/master/index.html
Source code
https://github.com/Zendom88/wiki_adoption
Milestone
- 22 Sep 16: Done first SIT version for Parallel Set, deploy to GitHub
- 23 Sep 16: Add Data source to enable switching between 2 types: [1,2,3,4,5] or [1,3,5] scoring.
- 25 Sep 16: Debug navigation. Deploy v1.0.1
Data analysis
Data Prep
- Translate feedback results to 3 levels: "High" "Normal" "Low"
Original feedback result contain 5 levels, 1 to 5. However, too detail may cause confusing, therefore, to enable having more general insight as well as be able to dive in and split in to detail, the data set is prepared with 2 way of measurement: Original (1-5) and Aggregated (1,3,5). The mapping is following:
- 1, 2 = Low (1)
- 3 = Normal (3)
- 4, 5 = High (5)

