ISSS608 2016-17 T1 Assign2 Abhinav Ghildiyal
Abstract
Wikipedia is a multilingual, web-based, free-content encyclopedia project supported by the Wikimedia Foundation and based on a model of openly editable content. Now days many people use Wikipedia because of its ease, usefulness, visibility, quality, social image, incentives and many other factors. In the similar fashion many faculty members across the world use Wikipedia as a teaching tool in recent years. In this assignment we will try to investigate what are the main factors which makes Wikipedia a likable or an unlikable tool based on the surveyed data collected from the 2 Spanish universities, by surveying the faculty members of those universities.
Theme of Interest
In the context of Wiki4HE assignment, i am undertaking an investigation on the perception of the faculty members towards the use of Wikipedia as a teaching tool and do a study on their attitude towards Wikipedia. I have specifically selected the Profile and Sharing Attitude to answer the following question -
- What are the perceptions of people about contributing to Wikipedia ?
- How many people participate in social network and what is their perception about social networking ?
- Perception about publishing the work in open platforms ?
- How the perception of people change with Age and PhD degree?
- Perception when it comes to gender and domain ?
- How perception of people change when they are registered users of Wiki across all age types ?
Data Preparation
The data for this assignment is taken from the UCI Machine Learning Repository. This data is about the ongoing research on university faculty perceptions and practices of using Wikipedia as a teaching resource.
The data set wiki4HE is in the csv format. The first step here is to make the data in the readable format. The wiki4HE.csv file is delimited with semicolon, using the Text to Column the csv file that is delimited with semi-colon is changed to tabular format.
Loading the data in JMP and preparing it for Analysis -
- There are few variables whose data type need to be changed such as Gender, Phd and University, which need to be changed from Continuous to nominal. At the same time Years of Experience need to be changed to Continuous.
- The data types of the responses are in Character - Nominal, which should be changed to Numeric - Nominal.
- Checking the missing values using the Missing Value Pattern of JMP.
- Using the Distribution, I will check the type of values captured in the columns and the statistics of that variable. While analyzing the distribution I saw that many columns has “?” as the value. Now based on the column we need to change “?” to “Other Domian” in Domains and “Others” in other columns.
- The data has a Age range from 23 to 69, so based on the general statistics I have recoded the age, 23 - 35 as Young, 35 - 50 as Middle and 50 - 69 as Old.
- Now for ease we will recode the data, based on the attribute information that we have, we will recode the data in JMP.
        a.  	 AGE: numeric

        b.	 GENDER: 0=Male; 1=Female

        c.	 DOMAIN: 1=Arts & Humanities; 2=Sciences; 3=Health Sciences;   4=Engineering &   Architecture; 5=Law & Politics

        d.	 PhD: 0=No; 1=Yes

        e.	 YEARSEXP (years of university teaching experience): numeric

        f.	 UNIVERSITY: 1=UOC; 2=UPF

        g.	 UOC_POSITION (academic position of UOC members): 1=Professor; 2=Associate; 3=Assistant; 4=Lecturer; 5=Instructor; 6=Adjunct

        h.	 OTHER (main job in another university for part-time members): 1=Yes; 2=No

        i.	 ‘OTHER_POSITION (work as part-time in another university and UPF members): 1=Professor; 2=Associate; 3=Assistant; 4=Lecturer; 5=Instructor; 6=Adjunct

        j.	 USERWIKI (Wikipedia registered user): 0=No; 1=Yes
Initial and Exploratory Analysis -
- Checking the correlation between the Age and Year of Experience
From the bivariate analysis we can infer that the Age and Year of Experience is not much correlated. They have the RSquare value of 0.30 which shows that the collinearity is less between these two variables.
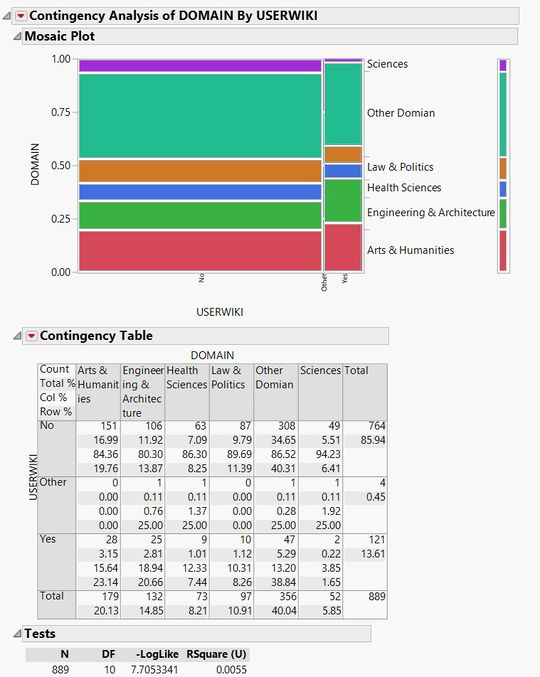
2. From the Contingency analysis of Domain and USERWIKI we can infer that professors with domain “Art and Humanities” are the maximum who are registered wiki users followed by “Engineering and Architecture”, “Law and Politics”, “Health Science” and “Sciences”.
3. From oneway analysis of age by domain we can infer that all domains have age ranging from 23 to 69.
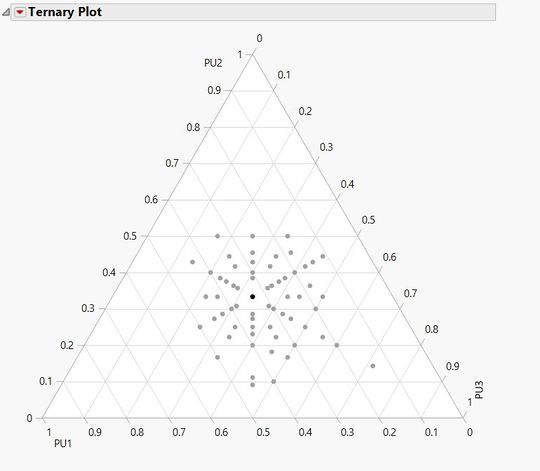
4. Ternary plot to see the correlation between the responses faculty has given using Likert scale ranging from strongly disagree (1) to strongly agree (5). From the chart below we can see that most of the data points lies in the centre, which means that if a person has given rating 1 for PU1 question then he has given the same or with a difference of 1 rating for the PU2 and PU3 questions, the same pattern is seen in other categories as well.
There are 43 questions, for which we have the response, which were asked by the professors and the ratings were taken, however these 43 questions are categorized under 13 questions. So I have taken the mean of the scores of the subcategory questions and formed the new column with the main category question with that mean value. So now the 43 questions columns are reduced to 13 columns. Below is the formula that I have used to take the mean.
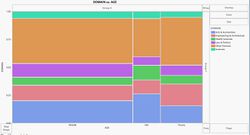
5. The mosaic between Age and Domain shows that the ratio of Middle age people is more as compared to Young and Old age and in that, out of the 5 domains 20% are in Arts and Humanities followed by Engineering and Architecture.
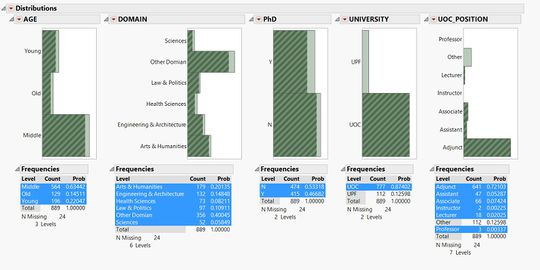
6. Now we see the ratio of university position in UOC university, we do the distribution of university and the UOC_Position, and if we select UOC , we could see that 72% are adjunct followed by 5% assistant, 7% associates, 2% lecturer, .2% instructor, .3% professor and 12% others. At the same time if we select UOC_POSITION adjunct, we could see that all the 3 age groups are in adjunct but maximum are from middle followed by young and old.


