ISSS608 2016-17 T1 Assign2 Franky Eddy
Contents
Abstract
Nowadays, internet has been one of the most popularly used technology to explore and find useful information. Wikipedia is one of the most commonly used source for studying as well as teaching resource.
- What
- How
- How
To answer these questions, data visualization is used to get insights:
Problem and Motivation
In order to
Approaches
Step 1: Identify a theme of interest
The wiki dataset consists of answers from survey for research on university faculty perceptions and practices of using Wikipedia as a teaching resource. Theme of interest that can be explored from the dataset is
Step 2: Define questions for investigation
There are 3 questions that will be investigated:
- How do respondents with different age groups rate their behavioral intention on Wikipedia?
- What
- What
Step 3: Find appropriate data attributes
After defining the questions, the next step is finding the appropriate data attributes.
Data Preparation
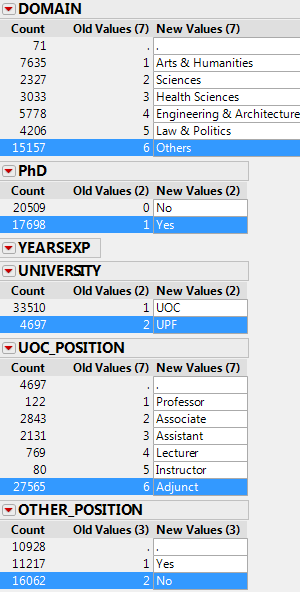
Before using the data to do analysis, firstly data preparation needs to be done. The first thing to be done is recoding all "?" values to blank values. After that, other variables such as Gender, Domain, PhD, YearsExp, University, UOC_Position, Other Position, OtherStatus, and UserWiki are also recoded as can be seen in the figure below.
After recoding the variable values, next, the dataset needs to be reshaped so that . The reshaped data can be seen in the figure below.
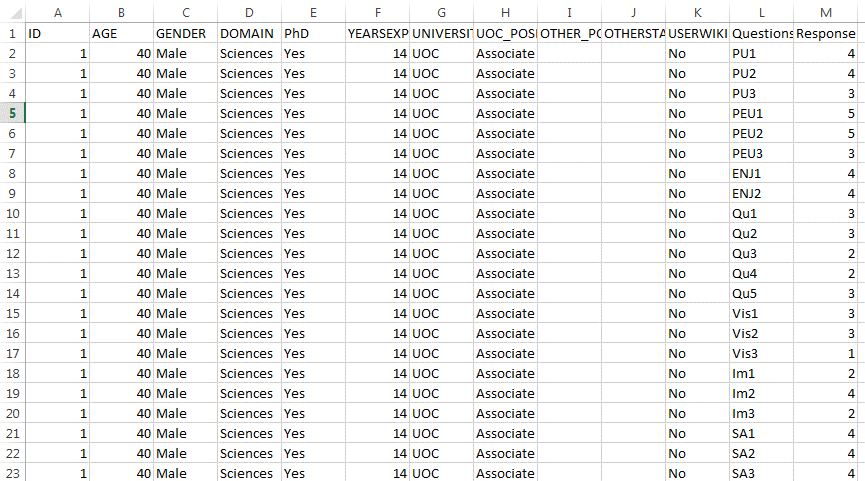
After reshaping the data, the data is now ready to be used for analysis.
Analysis
After preparing the data, next step is to do the analysis. The analysis is done to answer the questions that have been defined.
Results
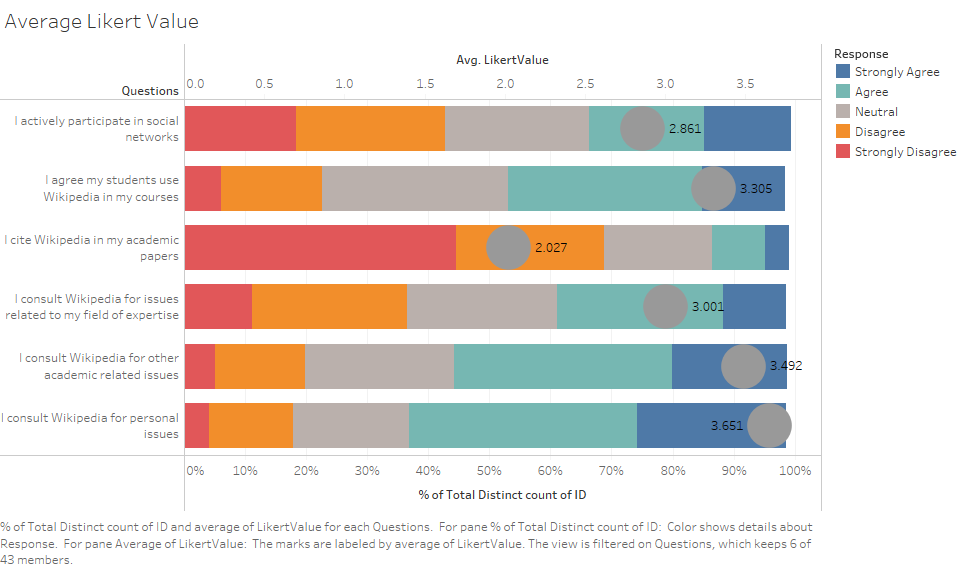
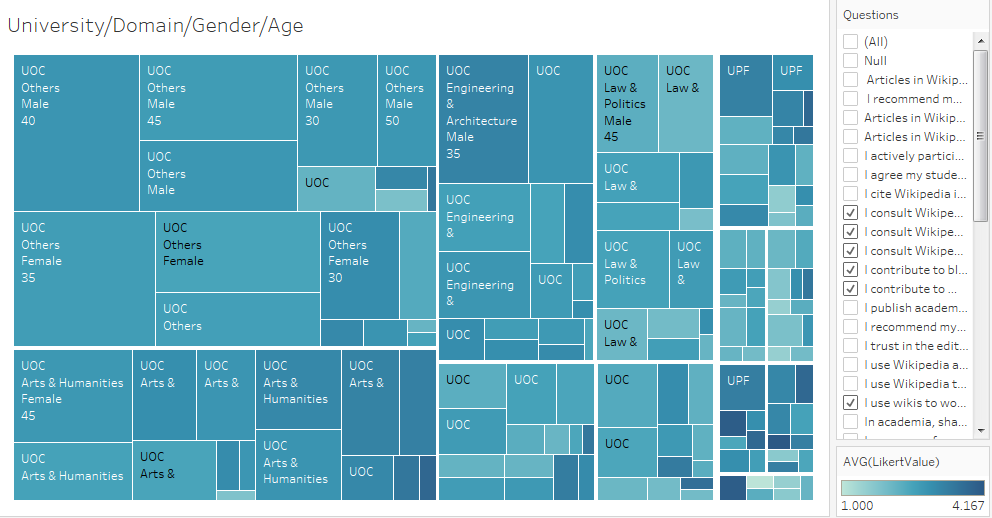
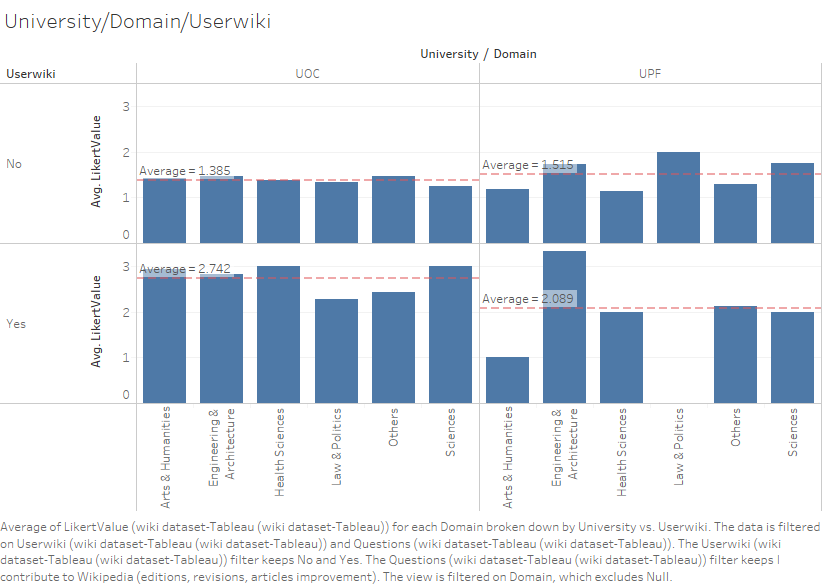
There are 3 results from the analysis:
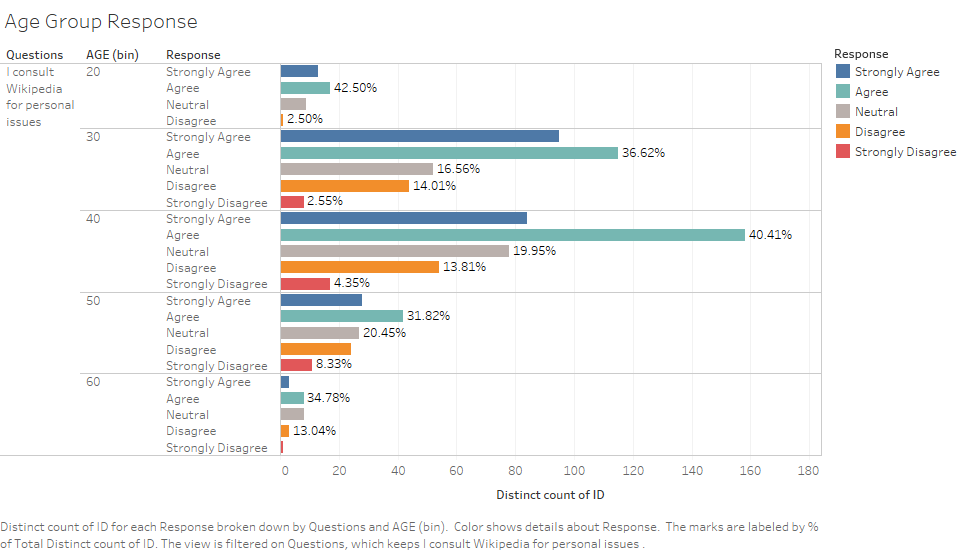
Link to Tableau Public :
Dashboard 1[1]
Dashboard 2[2]
Tools Utilized
The tools used for this analysis are Tableau 10.0, JMP Pro12, and Microsoft Excel, Tableau Public.
Charts used: Bar Chart, Stacked bar Chart, Treemap, Trellis Chart
References
http://www.datarevelations.com/using-tableau-to-visualize-survey-data-part-1.html
http://www.datarevelations.com/using-tableau-to-visualize-survey-data-part-2.html
