ISSS608 2016-17 T1 Assign2 Nguyen Tien Duong
Revision as of 22:09, 25 September 2016 by Tdnguyen.2015 (talk | contribs)
- WIP - Any comment is very much welcomed
Objectives
Overall mission
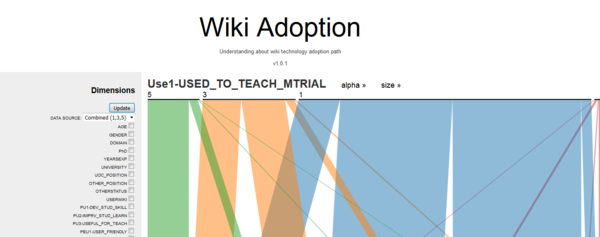
- Aimed to create Interactive Visualization using Parallel Sets (and maybe other charts) to discover causation relationship between factors that influence Wiki Adoption process.
- To hand-on D3.js and get hand dirty.
Questions to address
- Q1
- Q2
- ...
Application URLs
Application
 Tag v1.0 (milestone):
 https://rawgit.com/Zendom88/wiki_adoption/v1.0.1/index.html
 Dev master (updating on fly):
 https://rawgit.com/Zendom88/wiki_adoption/master/index.html
Source code
https://github.com/Zendom88/wiki_adoption
Milestone
- 22 Sep 16: Done first SIT version for Parallel Set, deploy to GitHub
- 23 Sep 16: Add Data source to enable switching between 2 types: [1,2,3,4,5] or [1,3,5] scoring.
- 25 Sep 16: Debug navigation. Deploy v1.0.1
Data analysis
Data Prep
- Translate feedback results to 3 levels: "High" "Normal" "Low"
- 1, 2 = Low (1)
- 3 = Normal (3)
- 4, 5 = High (5)
Analysis and Results
(outline)
Analyzing Process
- Define journey from Background to Behavior
- Approach: Start from Behavior, analyze the closest impact that is driven factor. Drill in further detail.
At a Glance: Who are "they"
- Stats
- Define 3 classes: outsider, user, advocator
- Factors that used for classification
What makes a advocator? What are they doing?
Who are users? Why do they use? Why some of them don't use?
Does Social effect matter?
tbc
