ISSS608 2016-17 T1 Assign1 Vaishnavi AMS
Contents
Abstract
Public housing in Singapore is governed by the Housing and Development Board(HDB). As per the latest findings from the Department of Statistics Singapore , more than 80 % of the population dwell in HDB flats and the rest of the population live in condominiums or landed properties. This project aims to find a trend in the resale market of flats in Singapore. With this information , we hope to identify certain key factors that impact the
the housing landscape in Singapore.
Problem and Motivation
In this project we will aim to answer the below questions with the help of the graphs and charts created
- the shares of the resale public housing supply in 2015
- Distribution of the resale public housing prices in 2015
- Compare the patterns of the first half of 2016 with the patterns of 2015
With the help of this information , we hope to better understand the preference of Singaporeans to the different flat models and the different towns and areas.
Tools Utilized
The following tools were used for the creation of charts and graphs
- Excel 2016 for cleaning the data and filtering them to represent only the 2015 and 2016 data
- Tableau 10.0 for data visualization and data analysis
Approaches
Data used for this project is from https://data.gov.sg We were able to extract the data for the year 2015 and 2016 and compare the results and make observations.
Observations
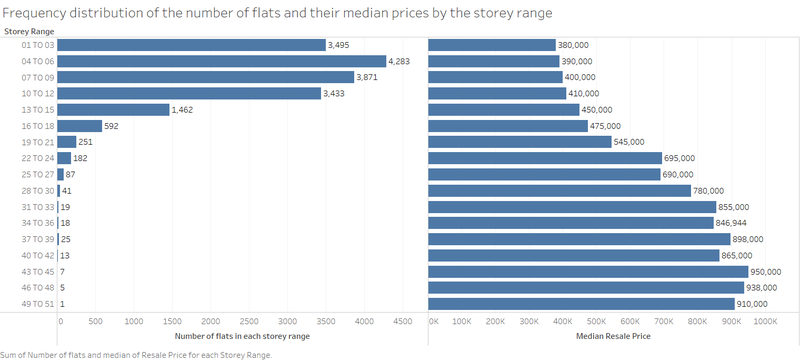
From the above graph we can deduce the below points ,
- As the storey range of the flag increases , the median resale flat price increases as well , which may point at a preference of the Singaporeans towards high scaled flats
- The number of flats that are in the resale market are primarily in the range of having storeys 01 to 21
We can understand more on this by observing the below bar chart
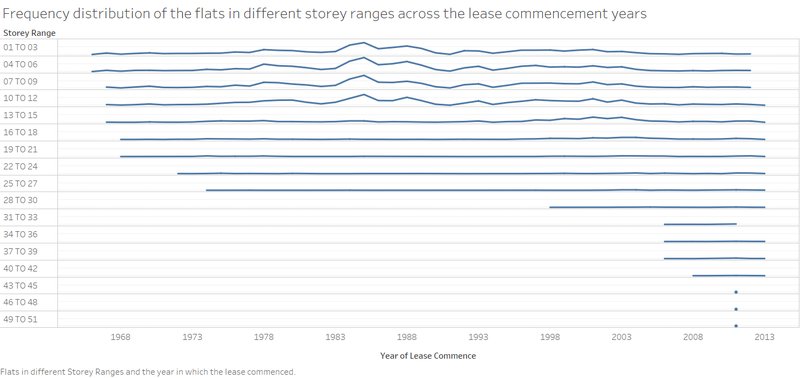
Most of the flats with storey range 01 to 21 currently in the resale market , had their lease commenced in the year 1968 to 1990's
But there are lesser number of resale flats for storeys 31 and above. This may be due to the below factor, when comparing against their lease commencement years
- The construction and lease of HDB flats with storeys 31 and above may have started only in the 1990's and they are relatively new and will take few more years before they enter the resale market
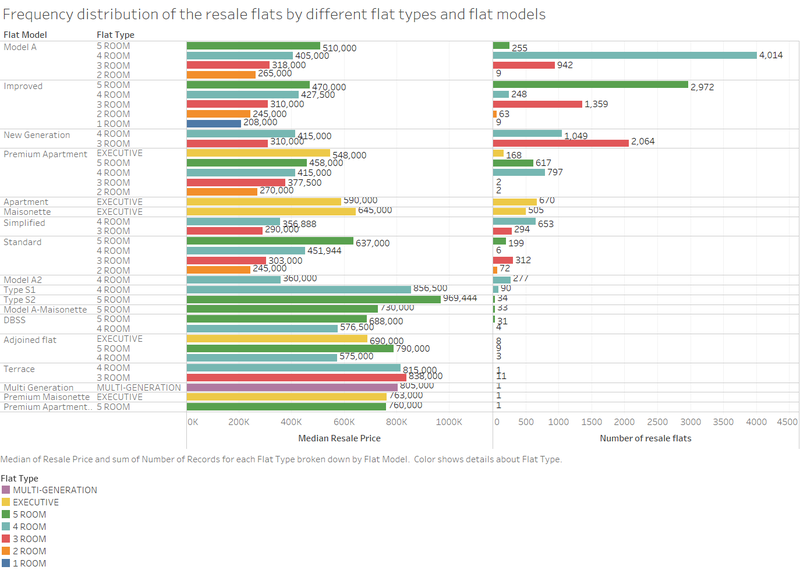
On further comparison of the median resale prices of flats in 2015 with the number of resale flats sold we can observe the below
- The type of flats preferred predominantly by Singaporeans are Model A Flats. More specifically Model A flats with 4 rooms. This attributes to 22.6 % of the flats sold in 2015.
- The next flat model preferred by Singaporeans are Improved 5 Room flats. This accounts to 16.7 % of the total number of resale flat transactions in 2015
- The above observations may be attributed to the fact that the average household size in Singapore is 3.39 in 2015 (As per the Department of Statistics, Singapore ) . This average is a dip from the previous year numbers of 3.43. If this trend continues we can see the demand for Model A 4 room flats and Improved 5 room flats to continue in future.
- The above graph also highlights the fact that Terrace , Premium ,and Multi Generation flats are less in demand and very few are in resale market. This may be due to the higher price range in comparison to the other flat models and smaller group of people eligible to apply for these properties.
Distribution of the resale public housing prices in 2015
Observation
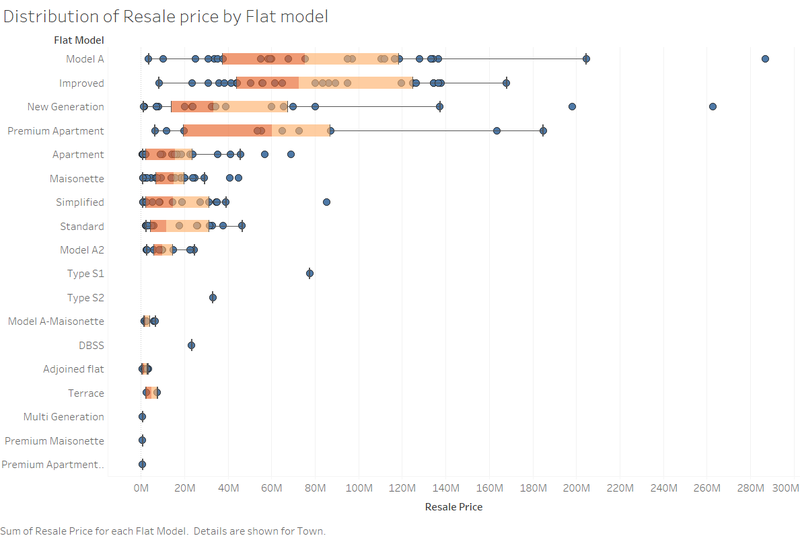
The above box plot aims to visualize the data distribution between the flat models in different towns and their resale price
The below can be observed by studying the box plot distribution chart
- For Model A flats , the ditribution is positively skewed ( Skewness : 1.25 and Excess Kurtosis : 1.98) and has a wide distribution of the prices due to the flats being sold in all towns observed and in varying numbers.
The outlier observed is for the resale flats sold in Tampines region , with more than 710 flats sold for a median $ 410 ,000
- For improved flats , the distribution is also positively skewed but with a lesser value (Skewness : 0.32 , Excess Kurtosis : -1.07)
The maximum sum of resale price in 2015 for Improved flats is for the Jurong West region and it lies closer to the Third quartile value
- For new generation flats , the distribution is also positively skewed with a high value of positive skewness in comparison to the rest of the flat models (Skewness : 1.79 , Excess Kurtosis : 2.37 ).
This can be attributed to a higher number of flats being sold in Bedok and Ang Mo Kio in 2015 in comparison to the rest of the towns.
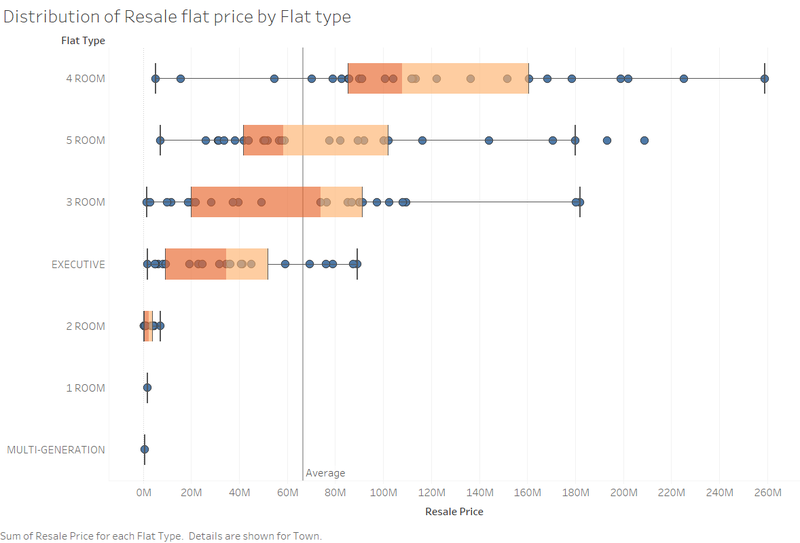
The above is a box plot that aims to visualize the data distribution between the flat type in different towns and their resale price. The below can be observed by studying the box plot distribution chart
- The 2, 3, 4, 5 and Executive flats all show positive skewness which may be attributed to more flats being sold with higher median resale prices
- This can be observed particularly in Tampines , Woodlands , Sengkang and Jurong West
- This maybe due to the lower resale prices in these regions and developing suburbs
Comparison of patterns of 2015 with 2016 in the housing sector
Observation
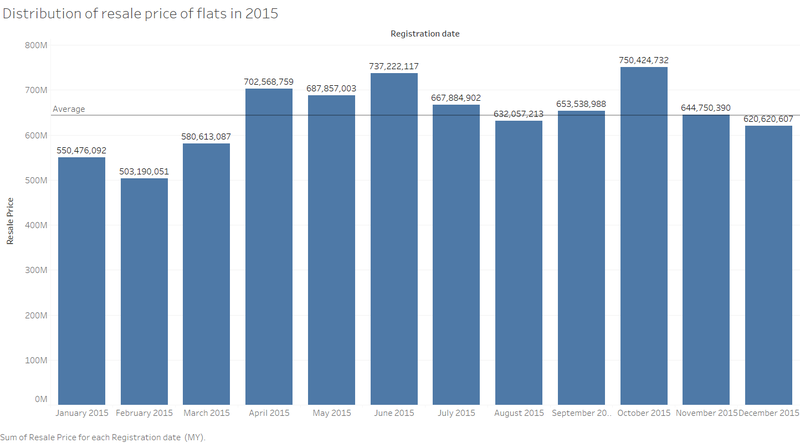
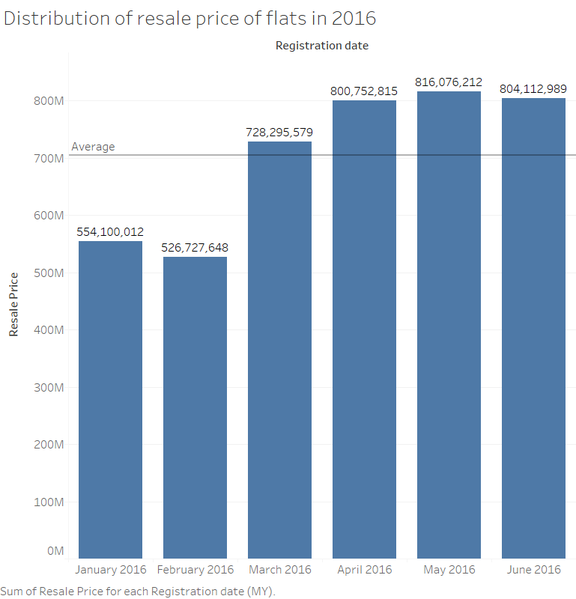
From the above two graphs it is evident , that the resale of prices follow a similar pattern across the months.
- We can observe a slump in sales in the first half of the first quarter - January and February in both 2015 and 2016
- Sales peak in second quarter particularly in June
- Following this trend in resale prices , we can predict there maybe a peak in sales in the fourth quarter in October followed by a decrease during December unless the trend is disturbed by social, economic and political factors.
- The figures also show that 2016 has slightly done better sales in comparison to 2015
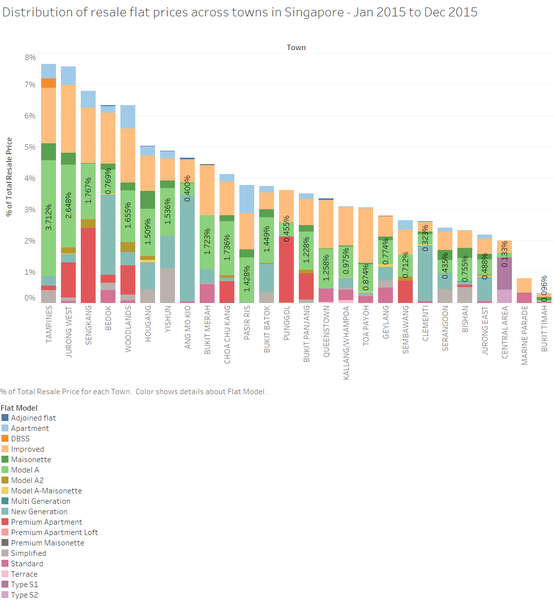
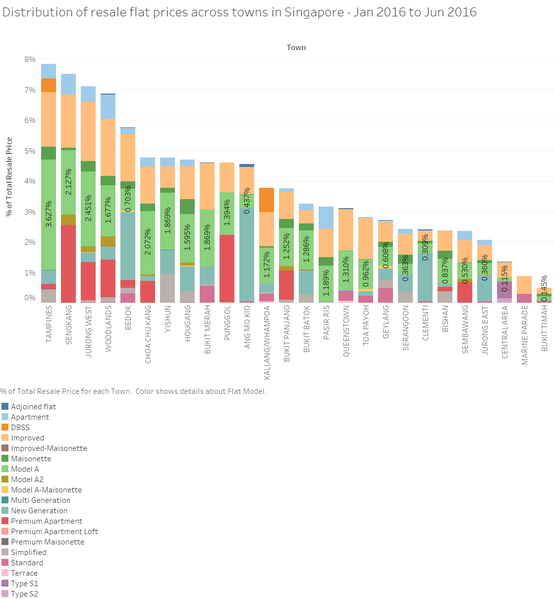
The above charts show the distribution of the resale flat prices across different flat types in different towns. On comparing the graphs of 2015 and the first half of 2016 we can observe many similarities
- The maximum resale revenue is from the following towns - Tampines , Jurong West , Sengkang , Bedok and Woodlands.
- Model A flats contribute to the highest percentage of resale revenue in both the years
- The percentage of revenue that each flat types in each town contribute to the total resale amount is nearly equal and follow a similar trend
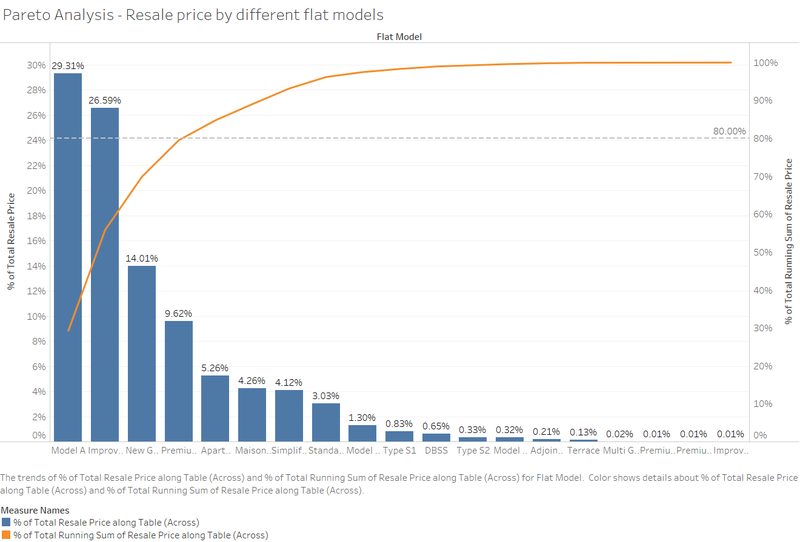
Pareto Chart - Resale prices of 2015 and 2016 by different flat models
From the Pareto Chart, it is observed that 80 % of the total resale price of the flats in both 2015 and 2016 is from Model A Apartments (close to 5 % of the total flat types) .
This observation does not seem to follow Pareto's 80-20 rule.
Results
From the findings from the above charts and graphs we can summarize as follows,
- Singaporeans on an average have 3 to 4 family member household and prefer HDB 4 room flats (Model A) followed closely by improved 5 room flats
- The housing market is moving away from Central areas in Sinagpore and moving towards the suburbs such as - Tampines , Jurong West , Sengkang and Bedok
- This is attributed to more flats on resale with a lesser medain resale price in comparison to the Central regions
- There is a slump in resale prices during the months of - December , January and Febraury
- There are more resale transactions during second quarter. This maybe the best time to look for resale especially in June
