ISSS608 2016-17 T1 Assign1 Parikshit Ravindra MAYEE
Contents
Abstract
The Housing & Development Board (HDB), Singapore's public housing authority, has built more than 1 million flats across the island and it homes more than 80% of Singapore's Population. Resale of these properties makes up a huge portion of yearly property transactions and hence requires a thorough analysis of past and present trends. In this project I will focus on analysis of resale HDB properties for 2015 and its comparable trends with first half of 2016.
Problem and Motivation
More often than not, our assumptions with respect to any trends are based on unverified facts and untested theories. Biased opinions on public portals only adds to this mess. To get a true picture of the situation, analysing the reliable data is the only true option.
With this project I intend to showcase the trends, distributions and correlation between various factors such as Property type, Property area, Resale price of property and number of property transactions to name a few.
I intend to use reliable datasets available from https://data.gov.sg/.
Approaches
Datasets
After exploring https://data.gov.sg/ site, I decided to make use of following datasets :
  i. Resale Flat Prices (Based on Registration Date), From March 2012 Onwards
 ii. Housing And Development Board Resale Price Index (1Q2009 = 100), Quarterly
iii. HDB Branches (SHP)
I decided not to use Resale Transactions by Flat Type (based on registered cases) dataset because I was unable to establish the reasons for difference in the count of transactions captured in Resale Flat Prices data set and the total transactions documented in this dataset.
Data Preparation
After loading datasets in Tableau I verified the datatypes, referring to metadata files available with dataset. One important change I did was creating a calculated field (Date) using column 'Month' and 'Quarter' in Resale Flat Prices and Resale Price Index dataset respectively. Calculation formulas had to be different due to difference in structure of Month & Quarter in original dataset.
For HDB Branches dataset, I used SAS JMP Pro to open and subsequently convert the dataset to .xlsx so that it can be loaded in Tableau.
I created more calculated fields in order to streamline my analysis process.
Exploration & Analysis
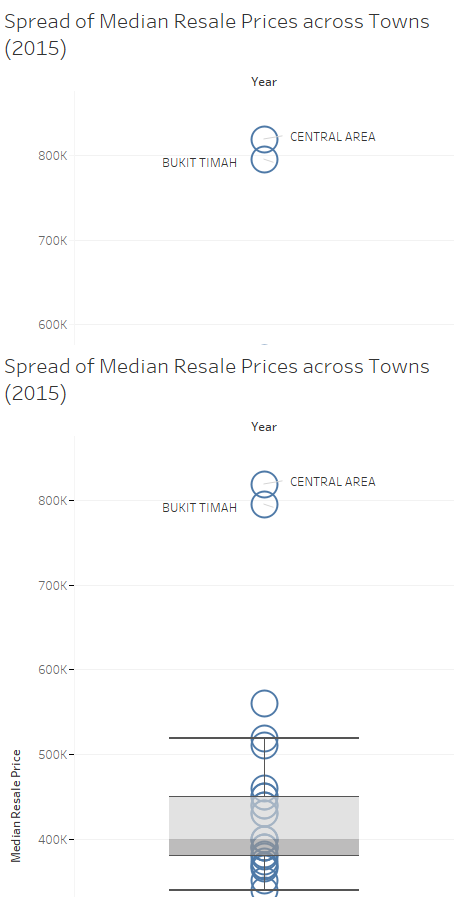
I decided to start with Box & Whisker analysis to look for spread of median resale prices across towns. My observations attached below.
Tools Utilised
1. Microsoft Excel : used to handle the basic operations of data file
2. SAS JMP Pro : Used to load SHP files and to convert them to .xlsx files
3. Tableau : Used for exploratory data analysis and to generate graphical representations
4. Microsoft Powerpoint : Used for preparation of final Infographic poster
Infographic Representation
