ISSS608 2016-17 T1 Assign1 Shishir Nehete
Contents
Abstract
The Project focuses on the latest trends in resale of the public housing supply (HDB). To start with analysing the trends in sales of the HDB, these are the key points to note:
- Flat type
- Town
- Storey range
- Resale price
- Demand and supply as per applications and registrations
The project gives insights about these factors and the meaningful conclusions that can be made using these insights.
Problem and Motivation
The initial step for buying or selling the property is the analysis of the trends of resale prices across multi variables, such as Flat type, Town, Storey range, Age of the flat. The potential buyers or sellers can study these trends to be aware of the present market scenario. Thus appropriate visualization of this data will enable them to understand these stats in a quick and efficient manner, and help them make well-informed decisions. This project will majorly focus on below points to gain insights from the data.
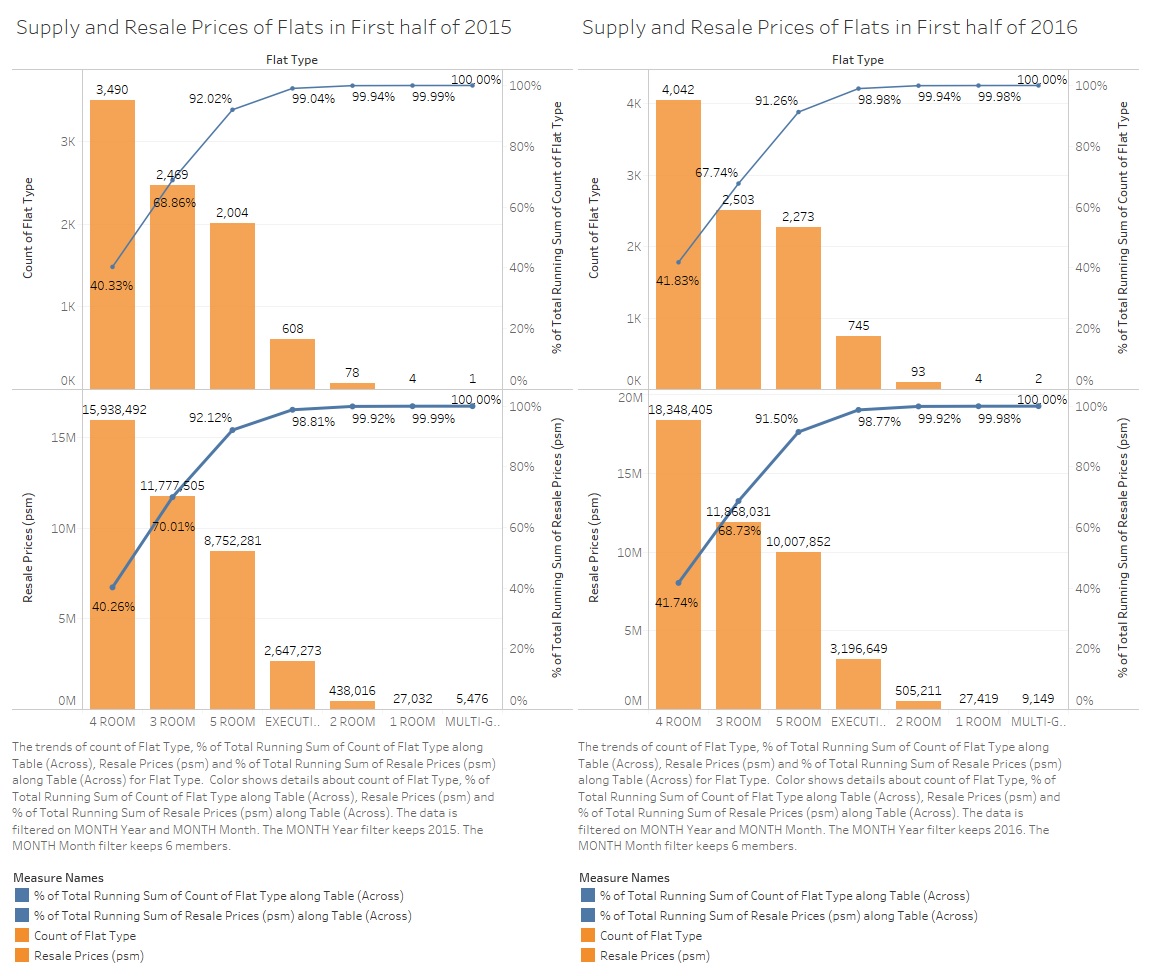
- What are the shares of the resale public housing supply in 2015 (at least three observation)
- What are the distribution of the resale public housing prices in 2015 (at least three observation)
- With reference to the findings, compare the patterns of the first-half of 2016 with the patterns of 2015
Approaches
Data Acquiration
As knowing the dataset for compilation is the first step of visualization, the data needs to be obtained from a reliable source. The data used for this project is found at Government database (https://data.gov.sg). Following datasets are used for further analysis.
- Resale Flat Prices (Based on Registration Date) from March 2012 Onwards. (https://data.gov.sg/dataset/resale-flat-prices)
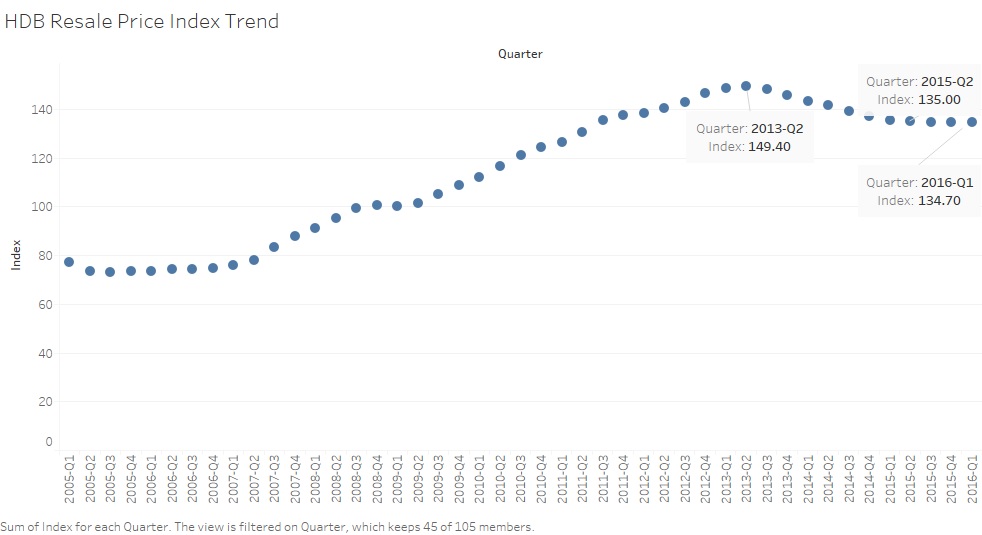
- Housing and development board resale price index quarterly. (https://data.gov.sg/dataset/hdb-resale-price-index)
Data Preaparation
The data acquired is clean and no missing values are noticed. However, the date field is in the string format which needs to be changed to date format. Hence we use the following formula for creating a new Calculated Field for Month Dimension.
- DATE(""+left([Month],4)+"-"+RIGHT([Month],2)+"-01")
Moreover, the resale price is given in units, so to analyse better, a new calculated field is created which specifies the Resale price per square meter. The formula for this calculated field is as below.
- [Resale Price]/[Floor Area Sqm]
Data Exploration
Data visualization techniques are used in this project for designing graphs and to depict a clear picture of the public housing supply over the year 2015. The shares of the resale public housing supply and the distribution of the resale public housing prices can be depicted across different variables. Also, the data is present for the first-half of 2016, so for comparing the patterns of first-half of 2016 with the pattern of 2015 we will consider data of first half of 2015 only.
Tools Utilised
- Tableau – To explore and visualize data for finding insights from the visualizations
- Power BI – To create visualizations and interactive graphs for counts of flats registered across the town in particular month of 2015.
- Microsoft Powerpoint – To create Infographics.
Results
Infographics
Demand and Supply of the flats over the year 2015:
The left bar graph shows the number of resale applications made over the year 2015 and the graph at right shows the number of successful registrations of the resale flats. This graph shows that most of the applications made were registered with the success rate of 92.11% overall (Total number of Applications: 19306, Total number of Registrations: 17784).
Though, we can also take an important insight that most applications were for the flat type 4-room, followed by 3-room and then 5-room respectively.
